

Most people sending LinkedIn outreach messages are doing it blind. They craft a message, send it to 50 prospects, and wonder why they’re getting a 2% reply rate while competitors see 8%. The difference isn’t luck—it’s testing. Without A/B testing, you’re guessing at what works instead of knowing.
Here’s what separates successful outreach teams from struggling ones: they test methodically. A single percentage-point improvement in reply rate doesn’t sound like much. But at scale, it’s the difference between booking 16 meetings and 24 meetings per 100 messages. Over a year, that’s 200 extra meetings. That’s the difference between hitting quota and crushing it.
Most people skip A/B testing because they think it’s too complicated. The truth is simple: send Version A to one group, Version B to another, compare results. That’s it. No fancy statistics required. Just discipline. Commit to 50 messages of each version over two weeks, track which version goes where, and compare reply rates.
This guide shows you exactly how to A/B test LinkedIn outreach messages, what metrics matter, and how to scale winning messages. You’ll learn what to test first, common mistakes to avoid, and how to turn testing into a repeatable system that compounds over time. In outbound sales, knowing beats guessing every single time.
Why A/B Testing LinkedIn Outreach Messages Actually Matters (And Why Most People Skip It)
Before diving into the how, let’s be clear about why this matters in the first place.
LinkedIn outreach operates in a really narrow window. You’ve got maybe 2 to 3 seconds for your message to register before someone scrolls past it or deletes it. Your headline, your opening line, your value prop, your call-to-action—every single element fights for attention in that tiny window. And what works for your SaaS product probably won’t work for someone selling consulting services. What resonates with a VP of Sales won’t resonate with a CMO.
This is exactly why A/B testing is non-negotiable.
When you’re sending 100 connection requests a week, the difference between a 4% reply rate and a 6% reply rate doesn’t sound like much. But compounded over a month, that’s the difference between 16 meetings and 24 meetings. Over a year, that’s the difference between 200 meetings and 300 meetings. Once you hit scale (and LinkedIn accounts can safely handle 100+ cold outreach messages per week), incremental improvements become exponential.
The second reason most people skip A/B testing is they think it’s too complicated. They imagine spreadsheets, control groups, statistical significance calculations, and all the overhead of running “proper” experiments. The truth is much simpler. A real-world A/B test on LinkedIn just means sending Version A to one group, Version B to another group, and comparing the results. Done.
Here’s the hard part though: most people don’t track the results rigorously enough to know what actually worked. They send Message A, get three replies, feel good about it, and then abandon it for Message B without ever knowing if the change was an improvement. That’s not testing—that’s guessing with extra steps.
How to A/B Test LinkedIn Outreach Messages: The Core Framework
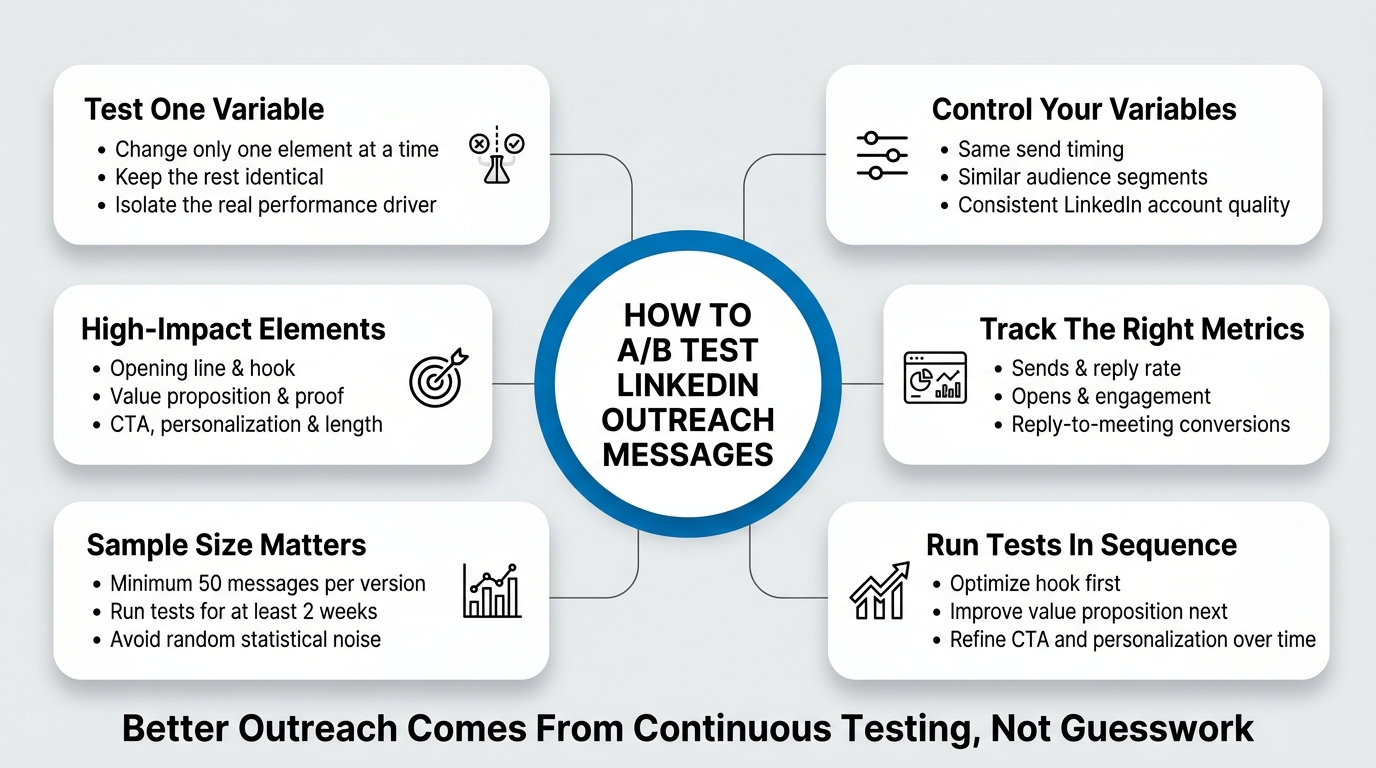
Let’s talk about the actual framework for running a solid A/B test on your LinkedIn outreach messages.
The framework has five moving parts: defining what you’re testing, setting up the sample sizes correctly, controlling for variables, measuring the right metrics, and running multiple tests in sequence. Miss any one of these and you’ll get noise instead of signal.
Defining What You’re Testing
The first thing to lock in is what variable you’re actually changing. This is more important than it sounds because most people don’t isolate variables properly. They’ll change three things at once (the headline, the value prop, and the CTA) and then pat themselves on the back when one version wins, not knowing which element caused the improvement.
Test one thing at a time.
If you’re testing subject lines (or in LinkedIn’s case, the headline of your message), keep the body copy identical. If you’re testing the opening line, keep everything else the same. If you’re testing the call-to-action, the rest stays locked in. This is the only way to know what actually drove a change in performance.
Here are the elements worth testing, in rough order of impact:
Opening line/hook. How you lead the message matters enormously. Does a personalized observation work better than a direct question? Does flattery work better than curiosity? Does a stat work better than a story?
Value prop. This is the core reason the person should care. Is it clearer if you lead with what you do, or lead with the problem you solve? Is it more compelling to talk about what they’ll get, or what they’ll avoid losing?
Personalization depth. This one’s tricky because it requires more manual work, but it’s worth testing. Does a deeply personalized reference to something on their profile increase reply rates enough to justify the time, or do generic-but-relevant messages perform just as well?
Proof element. What you include as social proof matters. Is a customer testimonial more effective than a metric? Is a specific case study better than a general result? Is a famous client name more effective than a vague “We’ve worked with 500+ companies”?
Call-to-action. How you ask for the meeting affects whether people take it. Does a soft CTA (“Would you be open to a quick chat?”) outperform a direct CTA (“Let’s schedule a call Tuesday”)?
Length. A short, punchy message vs. a longer message that gives more context. Spoiler alert: length matters less than most people think if the message is relevant, but it’s still worth testing for your specific audience.
Sample Size and Test Duration
Here’s where most A/B testers on LinkedIn get it wrong. They test too small.
You need to send enough messages that you can actually see a real difference, not just random noise. The minimum viable sample size depends on what your baseline reply rate currently is, but as a practical rule: don’t call a test “finished” until you’ve sent at least 50 messages of each version.
Why 50? Because at smaller volumes, one person’s bad day, one person’s inbox being full, or one person forwarding your message to a colleague can swing your results by 10%, and you won’t know if it was your message or just randomness.
Run your test for at least two weeks. This smooths out day-of-week effects. Monday outreach might perform differently than Friday outreach. Morning sends might get different reply rates than afternoon sends. By running for two weeks minimum, you average out those micro-factors and get closer to a true picture of which message actually works better.
Controlling for Variables
This is the part that separates a real test from a mess.
You need to keep as many variables constant as possible while you’re testing one element. Here’s what needs to stay consistent between your Version A and Version B:
Day of week and time of send. If you send Message A on Tuesday mornings and Message B on Thursday evenings, you’ll never know if Thursday evenings are just worse for your audience or if your message sucked. Send both versions at the same time of day, on the same days, to similar audiences.
Target profile. If possible, send both versions to prospects in the same role, same company size, same industry. The more homogeneous your target group, the cleaner your results. If you’re forced to test across different segments, note which segment got which message so you can separate that effect from the message effect.
Account reputation. If you’re testing from multiple LinkedIn accounts, keep this in mind. An account with 500 connections and a full profile will get different reply rates than an account with 50 connections and a sparse profile, regardless of what message you send. Run your A/B test from one account if you can.
Account warmup status. If you’re sending from an account that’s brand new to LinkedIn, your message performance will be suppressed. If you’re sending from an aged, active account, you’ll get better results. For a true A/B test, make sure both versions come from accounts in the same warmup phase.
These controls sound tedious, but they matter. Once you add in variables, you’re no longer testing which message works—you’re testing a whole bundle of things, and you won’t know which one actually moved the needle.
Tracking the Right Metrics
You need to measure four things during your A/B test: sends, opens (if trackable), replies, and replies converted to meetings.
Sends. This is your baseline. You need to know you actually sent the messages. Sound obvious? It is. But track it anyway because you need this to calculate reply rate.
Opens. LinkedIn doesn’t have read receipts like Gmail does, so you won’t know if someone opened your message unless they engage with a link. If you include a link with tracking in your message, you can measure click-throughs, which is adjacent to “opens.” Some people include a link to a one-page preview or asset as part of their call-to-action specifically so they can track engagement. That’s a valid approach, but know that it changes your message slightly and could affect your results.
Replies. This is your primary success metric. How many people replied to your message, regardless of whether they said yes or no? This number tells you if your message was interesting enough to warrant a response. Reply rate is calculated as (replies / sends) × 100. If you sent 100 messages and got 6 replies, that’s a 6% reply rate.
Reply-to-meeting conversion rate. Not all replies are wins. Some are “Not interested,” some are “Send me info,” some are “Already have a vendor.” You need a secondary metric: out of the people who replied, how many actually booked a meeting or became qualified leads? This is calculated as (qualified replies / total replies) × 100. If you got 6 replies and 2 of them converted to meetings, that’s a 33% reply-to-meeting conversion.
Here’s the thing: a message that gets a high reply rate but a low conversion rate from reply-to-meeting tells you something different than a message that gets a moderate reply rate but a high conversion rate. The first means you’re attracting the wrong people. The second means you’re attracting the right people but not communicating clearly enough what you want.
Track both numbers separately and think about what they tell you.
Running Tests in Sequence
The most powerful A/B testing approach isn’t to run one test and then stop. It’s to run test after test, month after month, building on what you learn.
Here’s the sequence:
Test 1: Opening line. Lock down the hook that gets the highest reply rate.
Test 2: Value prop. Once your hook is solid, test different ways of explaining why they should care.
Test 3: Proof element. Once they understand your value, test what makes them believe you.
Test 4: Call-to-action. Once they believe you and understand your value, test how you ask for the meeting.
Test 5: Personalization depth. Once the core message is dialed in, test if adding more personalization boosts reply rates enough to justify the work.
Each test builds on the previous one. You’re not starting from scratch each time—you’re taking the winner from the last test and improving it further. After running five tests, your outreach message is going to be radically different from where you started, and your reply rates will reflect it.
The A/B Testing Framework Table: Variables, Hypotheses, and Success Criteria
Here’s a practical table you can use to structure your tests:
| Test Number | Variable | Hypothesis | Version A | Version B | Primary Metric | Success Criteria | Expected Winner |
|---|---|---|---|---|---|---|---|
| 1 | Opening Line | A specific question outperforms flattery | “I noticed you just hired for product—is hiring a priority right now?” | “Your product is impressive—love how you handle X” | Reply Rate | Version A ≥ 5% | Version A |
| 2 | Value Prop | Problem statement outperforms benefit statement | “Most companies overspend on tools they barely use” | “We help you cut tool costs by 30% without losing functionality” | Reply Rate | Version B ≥ 6% | Version B |
| 3 | Proof Element | Named customer outperforms generic social proof | “We’ve worked with Stripe, Figma, and Notion” | “We’ve helped 200+ companies reduce costs” | Reply Rate | Version A ≥ 5.5% | Version A |
| 4 | Call-to-Action | Soft CTA outperforms hard CTA | “Would you be open to a 15-min call to explore this?” | “Let’s schedule 15 minutes Tuesday at 2pm—does that work?” | Reply-to-Meeting Conversion | Version A ≥ 35% | Version A |
| 5 | Message Length | Concise outperforms contextual | 2 sentences, straight to the point | 3 sentences with one-line context about their situation | Reply Rate | Version A ≥ 5% | Version A |
You can fill this in as you plan each test. The “Expected Winner” column is your hypothesis before you run the test. Once you have results, you add a “Actual Winner” column. If your hypothesis was wrong (and it will be sometimes), that’s valuable data that tells you something about your audience.
How to Actually Execute the Test on LinkedIn (And Common Mistakes to Avoid)
Knowing the framework is one thing. Executing it without introducing errors is another.
Here’s the step-by-step process for actually running your test:
Step 1: Decide on Your Sample Size and Timeline
Commit to sending at least 50 messages of each version over at least 2 weeks. Write this down. Do not deviate from it based on early results. Early results are noise.
The temptation to stop early is real. You’ll send 20 messages of Version A, get 2 replies (10% reply rate), then send 20 messages of Version B, get 0 replies (0% reply rate), and your brain will immediately declare Version A the winner. Stop. That’s not data—that’s randomness. With only 20 messages per version, a single extra reply in either direction swings your reply rate by 5%. You have no signal, only noise.
Fifty messages per version is the minimum threshold where random variation starts to average out and you can actually see a real difference. If you can send 100 messages per version, even better. The larger your sample size, the more confident you can be that any difference you see is real and not just luck. Write down your commitment before you start. 50 messages of each version. 2 weeks minimum. Do not negotiate with yourself when the test is halfway done. Discipline now saves you from making decisions based on incomplete data later.
Step 2: Prepare Your Messages
Write out Version A and Version B in full. Copy and paste each one into a document so you don’t accidentally send the wrong version to the wrong person. This sounds basic, but the number of people who wing it and then realize halfway through they sent the same message twice is higher than you’d think.
Create a simple two-column document: Version A in one column, Version B in the other. Make them side-by-side so you can visually compare what’s different (that’s the point—there should be exactly one difference). Now, before you send a single message, read both versions out loud. Does Version A sound natural? Does Version B? Are you confident these are the two things you want to test? Once you’re sure, lock these down. Do not edit them mid-test. Do not decide “oh, Version A would be better with a comma here.” You made your choice. Stick with it. Copy the full message into your outreach tool or directly into LinkedIn. The goal is to eliminate any possibility of accidentally sending the wrong version, or sending a partially-edited version that doesn’t match what you intended.
Step 3: Set Your Sending Schedule
Decide when you’ll send messages. Best practice: send between 9am and 2pm, Tuesday through Thursday. This avoids the Monday panic and Friday checking-out that can suppress reply rates. Use a scheduling tool or a calendar reminder to keep yourself on track.
Timing matters more than most people realize. Monday inboxes are flooded. People are defensive, their filters are higher, they’re clearing out a weekend backlog. Your message has a lower chance of standing out. Friday, people are mentally checking out, focusing on wrapping up the week, or already in weekend mode. Your message gets ignored or saved for later (which often means it never gets addressed). Tuesday through Thursday is the sweet spot—people are engaged but not drowning. Within those days, 9am to 2pm is optimal. Early morning (before 9am) you’re competing with their morning routine. Late afternoon (after 2pm) you’re fighting attention drift. Pick a specific time and stick with it for both versions. If you send Version A at 10am on Tuesday and Version B at 3pm on Friday, you’re not just testing your message—you’re testing different time-of-day effects too. That contaminates your results. Send both versions at the same time, same days, same everything except for the one variable you’re changing.
Step 4: Randomize Your Targets
When you’re about to send the 51st message, flip a mental coin and pick Version A or B. Better yet, have a helper or a simple random number generator pick for you. The goal is to avoid unconsciously sending Version A to “easier” targets and Version B to “harder” targets, which would bias your results.
This is subtle but critical. You have a list of 100 prospects. Some of them are warmer than others. Maybe the first 30 on your list work at companies you have relationships with. The next 70 are cold. If you consciously or unconsciously send Version A to the warmer 50 and Version B to the colder 50, your results won’t reflect which message is better—they’ll reflect which audience segment is warmer. Version A will look like a winner even if it’s actually worse. Prevent this by randomizing. Before you start, number your entire prospect list 1 to 100. Decide: odd numbers get Version A, even numbers get Version B. Or use a random number generator to assign each prospect a version. Or just flip a coin before each send. The method doesn’t matter. What matters is that your bias doesn’t decide which version goes to which prospect. Your randomization does.
Step 5: Track Ruthlessly
For every message you send, log: the recipient’s name, the version sent, the date sent, whether they replied, and if they replied, what they said. A simple spreadsheet works. If you’re running outreach at scale with software (like Dealsflow or another tool), you’ll have this data captured automatically in your campaign analytics.
This step separates people who test from people who think they test. You send 100 messages and then try to remember which version you sent to whom and who replied. That’s a nightmare, and you’ll lose data. Create a simple spreadsheet right now. Columns: Prospect Name, Company, Version (A or B), Date Sent, Replied (Yes/No), Reply Content. As you send messages, fill this in immediately. Takes 10 seconds per message. By the end of your test, you’ll have a complete record. When someone replies three weeks after your initial message, you can trace back to your spreadsheet, find their name, confirm which version they received, and count them in the right column. If you’re using outreach software, most platforms have this built in. You can filter by campaign (Version A or Version B) and see all replies in seconds. If you’re doing this manually, the spreadsheet is your lifeline. Do not skip this step.
Step 6: Wait the Full Duration Before Analyzing
I cannot stress this enough. Do not jump to conclusions after one week. The human brain is pattern-seeking and will find a “winner” in random data. Wait for your full 2+ weeks of testing, hit your 50+ messages per version, and then look at the numbers.
This is the hardest part psychologically. By day five of your test, you’ll probably have a hunch about which version is winning. By day ten, you’ll be fairly convinced. Your brain wants to optimize prematurely. Don’t let it. The only thing that matters is what the data says after you’ve hit your minimum sample size. Early data is unreliable. A person who replies on day two might have been in an exceptionally good mood that day. A person who ignores your message on day three might have been in an all-day meeting. These micro-factors blur the signal. By waiting two weeks, you average out the good days and bad days, the busy times and slow times, and you get closer to the true performance of your message. Set a calendar reminder for day 15. Do not look at the results before then. When day 15 arrives, pull all your data and analyze.
Step 7: Calculate Your Metrics
Pull your data and calculate:
- Version A reply rate: (Version A replies / Version A sends) × 100
- Version B reply rate: (Version B replies / Version B sends) × 100
- The difference between them: Version A rate minus Version B rate
- The reply-to-meeting conversion for each version: (Qualified replies / Total replies) × 100
Let’s say you sent 50 Version A messages and got 3 replies. That’s a 6% reply rate. You sent 50 Version B messages and got 2 replies. That’s a 4% reply rate. Version A wins by 2 percentage points. Now check the quality of those replies. Of the 3 replies to Version A, 1 was a “not interested,” 1 was “send me info,” and 1 was “let’s talk.” That’s a 33% conversion rate from reply to qualified meeting. Of the 2 replies to Version B, both were “let’s talk.” That’s a 100% conversion rate. Version A got more replies. Version B got better-quality replies. This tells you something different than just looking at reply rate alone. Version A has a better hook (more people replied), but Version B might be attracting more qualified prospects. Decide what matters more for your business right now. If you need volume, pick Version A. If you need quality, pick Version B. Most of the time, you’ll go with whichever has the higher reply rate, but knowing the conversion rate adds another dimension to your decision.
Key Metrics You Should Actually Care About (And Why Vanity Metrics Will Lie to You)
A lot of LinkedIn metrics sound good but don’t actually predict success. Let’s separate the signal from the noise.
Reply rate. This is your primary metric. If nobody’s replying to your messages, nothing else matters. A healthy cold outreach reply rate is anywhere from 4% to 10% depending on your audience, offer, and how warm your outreach is. If you’re at 2%, you’re underperforming and need to fix your message. If you’re at 12%, you’re doing really well and should be testing smaller optimizations.
Why is this your primary metric? Because reply rate tells you if your message was interesting enough to grab attention. It’s a direct signal of relevance. You can’t book meetings with people who don’t reply.
Reply-to-meeting conversion. Out of the people who reply, what percentage actually book a meeting or schedule a discovery call? This matters because two different messages can have the same reply rate but very different conversion rates. One message might get 5% replies, and 50% of those convert to meetings. Another message might get 7% replies, but only 20% convert to meetings.
The first message is more efficient. You’re spending less effort getting fewer replies, but more of those replies turn into actual revenue conversations. The second message casts a wide net but wastes your follow-up time on tire-kickers.
Cost per qualified meeting booked. If you’re running outreach at scale and you know how many minutes of work each message takes, you can calculate the actual cost (in your time or team time) per qualified meeting booked. Let’s say each personalized message takes 5 minutes to write and send. You send 100 messages, get 5 replies, and 2 of those convert to qualified meetings. That’s 500 minutes of work (100 messages × 5 minutes) to book 2 meetings, or 250 minutes per meeting.
Now you test a new message that’s quicker to personalize (3 minutes each), but gets slightly lower reply rate (4% instead of 5%). You send 100 messages, get 4 replies, and 2 convert. That’s 300 minutes of work to book 2 meetings, or 150 minutes per meeting. Even though the reply rate is lower, you’re more efficient.
This metric matters most once you have data on what quality meetings actually close at. But it’s important to track from the beginning because it forces you to optimize for something that actually moves revenue, not just vanity numbers.
Time-to-reply. How long after you send the message do people respond? This isn’t a success metric per se, but it tells you something about message relevance. If people are replying within 2 hours, your message was interesting enough that they stopped what they were doing to respond. If replies are coming in 2 days later, your message was probably something they came back to when they had spare time. Both can work, but the pattern tells you how strong your hook is.
Engagement rate (opens, clicks if you include links). This is secondary to reply rate. Someone can open your message and not reply. Someone can click a link in your message and not book a meeting. But open and click data can help you understand if people are even reading your full message. If opens are high but replies are low, your message hook is working but your value prop or CTA is weak. If opens are low, your subject line (or message preview) isn’t compelling.
Metrics to ignore:
Profile views. Seeing that your profile got viewed doesn’t mean anything. Lots of people glance at profiles out of curiosity and move on.
Connection request acceptance rate. If you’re sending connection requests followed by messages, the acceptance rate on the connection matters less than the reply rate on the message. Some people accept connections and ignore your message. Some people message-without-connecting or connect and message at the same time. What matters is message replies, not connection acceptances.
Conversation start rate. This is just another word for reply rate, and some tools use the term. Reply rate is clearer. Stick with that.
Total impressions or views. If you’re getting 100 profile views a week, that’s not a success metric. That’s potential. Replies are the actual success metric.
Building a Testing Culture: How to Run Tests Consistently Without Burning Out
A/B testing only works if you actually do it repeatedly. One test tells you something about one message. Five tests over three months tells you something about what works with your audience at scale. The real power of testing isn’t in a single test—it’s in the compounding effect of running tests back-to-back, building on winners, and gradually refining your approach until your outreach is unrecognizable compared to where you started.
The key to running tests consistently without it becoming a burden is to build a lightweight system. Without a system, testing feels like extra work. With a system, testing becomes part of your normal workflow. Here are five systems that separate teams that test once from teams that test relentlessly.
System 1: Keep a Master Template
Don’t write each message from scratch. Develop a baseline message structure that works, and then just swap one variable for each test. Here’s an example:
Baseline structure:
- Hook (1-2 sentences)
- Value prop (1-2 sentences)
- Proof (1 sentence)
- CTA (1 sentence)
Test 1: Swap in a different hook. Keep everything else identical. Test 2: Keep the winner hook from Test 1. Swap in a different value prop. Test 3: Keep the winner hook and prop. Swap in different proof.
This approach saves enormous amounts of time. Instead of staring at a blank screen writing a completely new message for Test 2, you just copy your Test 1 winner, change one section, and you’re done. You’re not reinventing the wheel each time. You’re building on what works. This also keeps your tests clean because the structure stays consistent—you know exactly where the hook is, where the value prop is, where the proof is. When you test, you’re changing one block, not touching the others. After five tests using this system, you’ll have a message that’s 5x stronger than where you started, built incrementally from a solid foundation.
System 2: Batch Your Testing
Don’t run tests continuously throughout the month. Instead, pick one week each month to run your A/B test. This gives you a defined period to send messages and then a full month to analyze the results and implement changes. Much less cognitive load than testing continuously.
If you’re testing every week, you’re constantly in a state of “which version am I sending today?” Your brain is context-switching. You’re tracking multiple tests at once. You’re analyzing results while running new tests. It’s chaotic. Instead, declare Testing Week. Pick the second week of each month (or whatever works for your schedule). During that week, you send your 50+ messages of each version, nothing else changes. Outside Testing Week, you send only your current winner to new prospects. Then the week after Testing Week, you analyze results and decide on next month’s test. This rhythm is sustainable. Your team knows when testing happens. You’re not juggling multiple simultaneous tests. You analyze with a clear head because you’re not also in the middle of sending test messages.
System 3: Document Your Results in One Place
Keep a testing log. Every time you finish a test, add a row with the variable tested, your hypothesis going in, the winner, and the percentage point difference. Over six months, this log becomes a proprietary knowledge base of what works for your specific audience. You’ll start to see patterns. You’ll learn things like “Questions always outperform statements” or “Mentioning a customer name outperforms mentioning a metric.”
This log is invaluable because it prevents you from testing the same thing twice and it accelerates learning. In month one, you might test “Question opening vs. Statement opening” and learn that questions win by 1.2%. In month four, you might be tempted to test something similar but worded differently. Instead, you look at your log, see that questions consistently outperform statements across your audience, and you skip that test entirely. You move on to something you haven’t tested yet. Over time, your log becomes a map of your audience’s preferences. You’ll see that for your specific ICP, certain types of proof always outperform others. Certain CTAs consistently convert better. You’ll build institutional knowledge that would take a new team months to discover from scratch. Keep this log in a shared spreadsheet or document. When you hire a new SDR or grow your outreach operation, they inherit six months of accumulated insights instead of starting from zero.
System 4: Raise the Bar Gradually
Your first A/B test might compare “let’s talk” versus “let’s chat.” That’s a small difference. Your fifth test might compare two completely different approaches to opening the message. As your baseline message gets stronger, your tests get more nuanced. You’re not looking for 2-3% improvements anymore. You’re looking for incremental gains on an already-solid foundation.
This is important because it prevents burnout and keeps expectations realistic. Early tests often show 2-5% differences because you’re moving from a weak baseline. You find a hook that actually works, and it’s an obvious improvement. But once you’ve locked down a good hook, a good value prop, and a good proof element, the remaining improvements get smaller. Test 5 might only improve reply rate by 0.5%, which feels disappointing compared to Test 1’s 3% improvement. But 0.5% is still meaningful at scale. The point is to understand that your testing curve follows a natural pattern. You get quick wins early. You get harder-fought wins later. Both are valuable, and both require the same discipline to execute.
System 5: Know When to Stop Testing and Start Scaling
At some point, your message is good enough that you should stop optimizing and start scaling. The point is not to achieve perfection—it’s to reach a point of diminishing returns where the time spent testing is greater than the value gained. If your reply rate is stable at 6% and you’re converting 30% of replies to meetings, you’ve probably found something that works. It might still be improvable, but you should spend your time sending more of these messages to more people, not tweaking the wording of them.
This is the hardest decision for many teams because the optimization mindset is addictive. You’ve found a winner, and you think “what if we could get it to 7%?” The answer is probably yes, you could. But at what cost? If it takes you two months of testing to move from 6% to 7%, and in those two months you could have sent 2,000 additional messages with your 6% message, you’ve actually made less progress. You’ve booked fewer meetings. You’ve generated less pipeline. The math of scaling beats the math of optimizing once you’re above a baseline threshold. A good heuristic: if you’ve done five consecutive tests and are consistently hitting 5%+ reply rates, call it a win and start scaling. Run that message to 500+ prospects. Build volume. You can test new approaches in parallel if you want, but your primary effort should be volume, not optimization. You can always come back to optimization next quarter once you’ve saturated your current audience.
Tools and Automation: Setting Up A/B Testing Infrastructure Without Manual Chaos
If you’re sending 50+ messages per version, you can do this all manually with spreadsheets and discipline. If you’re running outreach at agency scale (managing dozens of campaigns or multiple accounts), you need infrastructure.
Here’s what to look for in a tool for A/B testing your LinkedIn outreach:
Built-in campaign management. You need to set up campaigns where you can specify which contacts get Message A and which get Message B, send them on a schedule, and have the system track which message was sent to whom. Manual isn’t scalable.
Automated reply tracking. The tool should log when replies come in, what they said, and which message version they’re replying to. This saves you hours of manual data entry.
Analytics dashboard. You should be able to see reply rate per message variation with a few clicks, not by manually pulling data from multiple spreadsheets.
Multivariate testing (nice to have, not required). Some tools let you test more than two variations at once. If you want to test A, B, and C in parallel, that’s a huge time-saver. But it’s not essential.
A/B testing for connection requests (if relevant to your workflow). Some tools let you A/B test the connection request message itself, not just follow-up messages. If this is part of your workflow, it’s worth having.
Tools like Dealsflow (especially if you’re running multi-account outreach or want AI-assisted follow-ups), HeyReach, Expandi, and others in the LinkedIn automation space all offer campaign management and built-in testing features. The specific tool matters less than having a system instead of a spreadsheet.
Mistakes People Make in A/B Testing LinkedIn Outreach (And How to Avoid Them)
I’ve mentioned some of these already, but let’s consolidate the ones that trip up most people:
Mistake 1: Changing the message format mid-test.
You start testing with a 3-sentence message, but halfway through, you realize you want to test a 2-sentence version. You swap, but now your data is mixed—some people got the 3-sentence version, some got the 2-sentence version. That’s not a single test, that’s a mess. Commit to the variable and the timeline. Change only after the test is done.
Mistake 2: Not accounting for LinkedIn algorithm effects.
LinkedIn’s algorithm is constantly changing. Your outreach performance can vary based on account age, engagement level, network size, and other account-level factors. If you test a new message and get worse results, it might not be the message—it might be that LinkedIn is throttling your account or that your network is less relevant right now. Keep some version of your message going as a control so you can measure the difference between “the message got worse” and “the platform shifted.”
Mistake 3: Assuming one person is representative of your entire audience.
You get three incredible replies to Message A and zero to Message B, so you pick Message A as the winner. But you’ve only sent 12 messages total. That’s one person’s good day, not data. Minimum 50 messages per version, remember?
Mistake 4: Optimizing for the wrong metric.
You can get obsessed with reply rate because it’s easy to measure. But if you’re optimizing purely for replies and ignoring the quality of those replies, you’ll end up with a message that gets a lot of people saying “not interested” or asking you to send information. That’s a high reply rate with zero revenue. Test with the end in mind. What matters is meetings booked or deals closed, not just inboxes filled.
Mistake 5: Not giving yourself enough rest between tests.
If you finish one test and immediately start another test with the same audience, you run the risk of audience fatigue. The people who ignored Message A are now seeing Message B from the same account. They’re already primed to ignore you. Between tests, give it at least a week where you send to a different audience or send a softer message that isn’t part of an active test. Let people forget you exist before you come back with a new message.
Mistake 6: Testing things that don’t scale.
You find that a message with 10 lines of personalization gets incredible results. So do you change all your messages to require 10 lines of personalization? No. If it doesn’t scale to your volume, it doesn’t matter. Test things you can actually execute consistently.
How to Scale Winning Messages Across Accounts and Campaigns
Once you’ve found a message that works, the question becomes: how do I use this across my entire outreach operation?
Here’s the best approach:
Lock in the winning message structure first.
Before you copy the message to 10 other accounts or 100 new prospects, live with the winning message for at least one more week and collect data from 30+ new sends. You want to be sure the win is reproducible, not a one-time fluke. Some people call this the “validation week.” You already tested it and found a winner. Now you’re validating that the winner is consistent.
Adapt it slightly for different audiences, but keep the core.
If your winning message was tested on VPs of Sales, and you now want to use it on marketing directors, don’t just copy and paste. The opening line might need to shift to address a marketing-specific pain, but the value prop and proof structure should stay the same. This is different from testing. You’re taking a proven structure and tailoring it to a new segment.
Track aggregate performance across contexts.
Once you’ve scaled the message, you should see similar performance (maybe slightly lower, depending on context) across new audiences and accounts. If your winning message got 6% reply rate in your test, and you’re now seeing 2% when scaled across 500 new contacts, something is wrong. Either the message doesn’t translate to this audience, or there’s an account reputation issue. Investigate before assuming your test was wrong.
Create version control.
Give your winning message a name and version number. Message Version 3.2, or whatever. When you iterate and test a new version, call it 3.3. Keep a master document of message history so if a new version underperforms, you can go back to 3.2 without losing it.
Real-World Example: A/B Test Case Study (How One Team Got from 2% to 6% Reply Rate)
Let me walk you through a real (anonymized) example to make this concrete.
A SaaS company selling API infrastructure was getting a 2% reply rate on their cold outreach. They were sending messages to CTOs and engineering leaders, but the message wasn’t resonating.
Test 1: Opening line.
They hypothesized that leading with a problem was better than leading with a question.
Version A: “Hey [name], I noticed [company] uses [tech stack]. Are you open to exploring a faster way to integrate?” Version B: “Hey [name], [company] pays a fortune for API infrastructure—most companies in your space do.”
Result: Version B got 3.2% reply rate. Version A got 2.1%. Version B won.
Test 2: Value prop.
Now they knew that starting with a problem worked better. The question was: did they care more about cost or speed?
Version A (winner from Test 1): “…most companies in your space do. We help engineering teams cut API response time by 40% while reducing infrastructure costs. Worth a conversation?”
Version B (winner from Test 1): “…most companies in your space do. We help you consolidate API infrastructure to a single platform. Most customers cut their total spending by 30%. Make sense?”
Result: Version B got 4.8% reply rate. Version A got 3.4%. Version B won. Turns out cost was the bigger motivator than speed for this audience.
Test 3: Proof element.
Now they wanted to know: does naming a specific customer outperform a metric-based proof?
Version A: “We work with companies like Stripe, Shopify, and Figma. They’ve cut costs by 30% on average.” Version B: “We’ve worked with 200+ companies in fintech and e-commerce. They cut costs by 30% on average.”
Result: Version A got 5.1% reply rate. Version B got 4.3%. Version A won. The named customers were more credible than the generic proof.
Test 4: Call-to-action.
The company was at 5.1% reply rate. Now they wanted to test if changing how they asked for the meeting affected the conversion rate from reply-to-meeting.
Version A: “Would you be open to a quick 15-minute conversation?” Version B: “Let’s schedule a time to chat this week. What day works best?”
Result on reply rate: Both were about the same (5.0% vs 5.1%). But on the conversion from reply-to-meeting, Version A got 45% conversion while Version B got 28%. Version A won. The softer ask actually got more people to commit to a meeting when they replied.
Final result
After four tests over two months, the company went from 2% reply rate to 5.1%, and the people who replied were more likely to actually schedule a call. Over a quarter, this meant an extra 20 meetings booked per 1,000 messages sent, which meant an extra 2-3 deals closed.
The winning final message looked like this:
“Hey [name], I noticed [company] uses [tech stack]. Most companies in your space spend a fortune on API infrastructure. We work with companies like Stripe, Shopify, and Figma to consolidate API infrastructure to a single platform and cut costs by 30%. Would you be open to a quick 15-minute conversation to see if that applies to you?”
It wasn’t revolutionary. It was just methodically better than what they started with, because they tested one variable at a time and stayed disciplined about it.
Conclusion
Here’s the thing about A/B testing your LinkedIn outreach messages: it’s not fancy, and it’s not complicated. It’s just disciplined.
Most people in outbound sales are sending the same message to everyone, never testing, and wondering why they’re plateauing. You now know better. You know how to isolate variables, run proper tests, measure the right metrics, and compound small improvements into massive ones.
Start with one test. Lock in one variable. Send 50 messages of each version. Measure reply rate. Pick a winner. Then repeat. After three months of this, your outreach will be unrecognizable compared to where it started—and your reply rates will show it.
The real advantage isn’t the test itself. It’s the fact that you’re willing to test while your competitors are guessing.
Your next step: Identify the single element of your current message that you suspect is weakest (probably the opening line). Write an alternative version. Commit to sending 50 of each version over the next two weeks. Track your reply rate. Let the data tell you what works. Then pick the next element to test.
Don’t overthink it. Just test.
Frequently Asked Questions
1. How many messages do I need to send before I know if a test “won”?
At minimum, 50 messages of each version. At smaller volumes, random variation will overwhelm real differences. If you have the capacity, 100 messages per version gives you even more confidence. The rule of thumb: test until you have enough data that a 2-3% difference in reply rate is unlikely to be random chance.
2. Does the time of day I send messages affect reply rate?
Yes. Messages sent between 9am and 2pm generally get higher reply rates than messages sent early morning or evening. Tuesday, Wednesday, and Thursday typically outperform Monday (inbox overwhelm) and Friday (people checking out). However, this varies by audience. If your audience is in a different timezone or works non-traditional hours, test your own timing. The principle matters more than the specific time.
3. Should I A/B test connection request messages separately from follow-up messages?
Ideally yes, but only if you have the volume. If you’re sending 100 connection requests a week, you can test different connection request approaches. If you’re sending 20 a week, it’s not worth the effort. Most outreach impact comes from the follow-up message after they accept the connection anyway, so optimize that first.
4. What’s a “good” reply rate for cold LinkedIn outreach?
4-8% is healthy for most B2B outreach. If you’re at 10%+, you’re doing excellent. If you’re below 2%, your message fundamentals need work. These benchmarks assume moderate personalization and an appropriate target list. Highly personalized outreach or extremely warm audiences can hit 15%+. Cold, untargeted outreach might only hit 0.5%.
5. If I find a winning message, how long should I use it before testing again?
Use your winning message for at least one full month before testing a new variable. This serves two purposes: it validates that the win is real and not a fluke, and it gives you a baseline to compare your next test against. If you test a new message and it underperforms the old one, you’ll know for sure that the change made it worse.
6. Can I A/B test multiple elements at the same time to save time?
You can, but it’s much harder to interpret the results. If you test new opening line + new value prop + new CTA all at once, and the message wins, which element was responsible? You won’t know. It’s faster to test single variables sequentially than to test multiple variables and then have to re-test individual elements because you can’t isolate what worked.
7. Does LinkedIn suppress performance from brand-new accounts?
Yes. A LinkedIn account with zero connection requests sent and zero posts will have suppressed outreach performance for the first few weeks as LinkedIn watches for spam patterns. Once an account has sent 50+ connections and received positive engagement, performance normalizes. If you’re testing from a brand-new account, factor this in. Ideally test from an aged account with some existing engagement.
8. What should I do if both message versions perform identically?
If two message variations get the same reply rate, there are a few options: (1) pick the shorter one to save time, (2) pick the one that feels more natural to you, (3) test a completely different variable because this micro-variation doesn’t matter. An identical result means you’ve found the limit of that particular change—time to move on.
9. If my reply rate drops during a test, should I stop and investigate?
Not immediately. Wait until you’ve collected 30-50 messages before deciding there’s a problem. One week of lower performance might just be the random variation of who happened to be in your messaging queue. However, if you drop below 1% reply rate, something is wrong—either the message, your account reputation, or your targeting. Investigate then.
10. How do I know if a message change is worth the effort if it only improves reply rate by 0.5%?
Calculate the actual impact. If you’re sending 1,000 cold outreach messages a month, a 0.5% improvement means 5 extra replies per month, or 60 extra replies per year. If 30% of replies convert to meetings, that’s 18 extra meetings per year. If your close rate is 20%, that’s 3.6 extra deals per year. If your deal value is $50,000, that’s $180,000 in extra revenue from a message tweak. Now does the change seem worth it?
11. Should I use an automation tool or handle A/B testing manually?
If you’re sending fewer than 50 messages per week, manual tracking is fine. If you’re sending more than 200 messages per week, you need a tool. The breakeven point is around 100 messages per week—at that volume, the time you save with a tool makes the cost worthwhile.
12. Can I test the same message variation against different audiences and combine the results?
No, not cleanly. Different audiences will respond differently to the same message. An audience of VPs will have different reply rates than an audience of managers. If you want to test across different audience segments, track results separately so you know the reply rate for each segment. You can combine results if you’re confident the audiences are homogeneous (same title, same company size, same industry).