
LinkedIn has changed more between 2024 and 2026 than in the five years before that combined. The platform now has over 1.3 billion members, AI-generated outreach is flooding inboxes at scale, and LinkedIn’s spam detection systems have grown significantly more aggressive. In this environment, sending outreach without knowing your benchmarks is not just inefficient — it is actively harmful to your account’s standing on the platform.
Response rate is the single metric that tells you whether your outreach is working. Not connection acceptance, not open rate, not impressions. Reply rate is where strategy meets reality. A prospect who accepts your connection request but never replies has not moved your pipeline. A prospect who responds to your InMail is a conversation — and conversations become meetings.
This guide brings together data from multiple large-scale LinkedIn outreach studies — including Expandi’s analysis of over 20 million outreach attempts and the Belkins 2025 LinkedIn B2B study — to give you a complete, channel-by-channel, industry-by-industry benchmark reference for 2026. Every number in this guide is sourced. Nothing is guesswork.
Why LinkedIn Response Rate Benchmarks Changed in 2026
Understanding where the numbers sit today requires understanding why they shifted in the first place. The LinkedIn outreach landscape of 2026 looks fundamentally different from even two years ago, and the benchmarks reflect that.
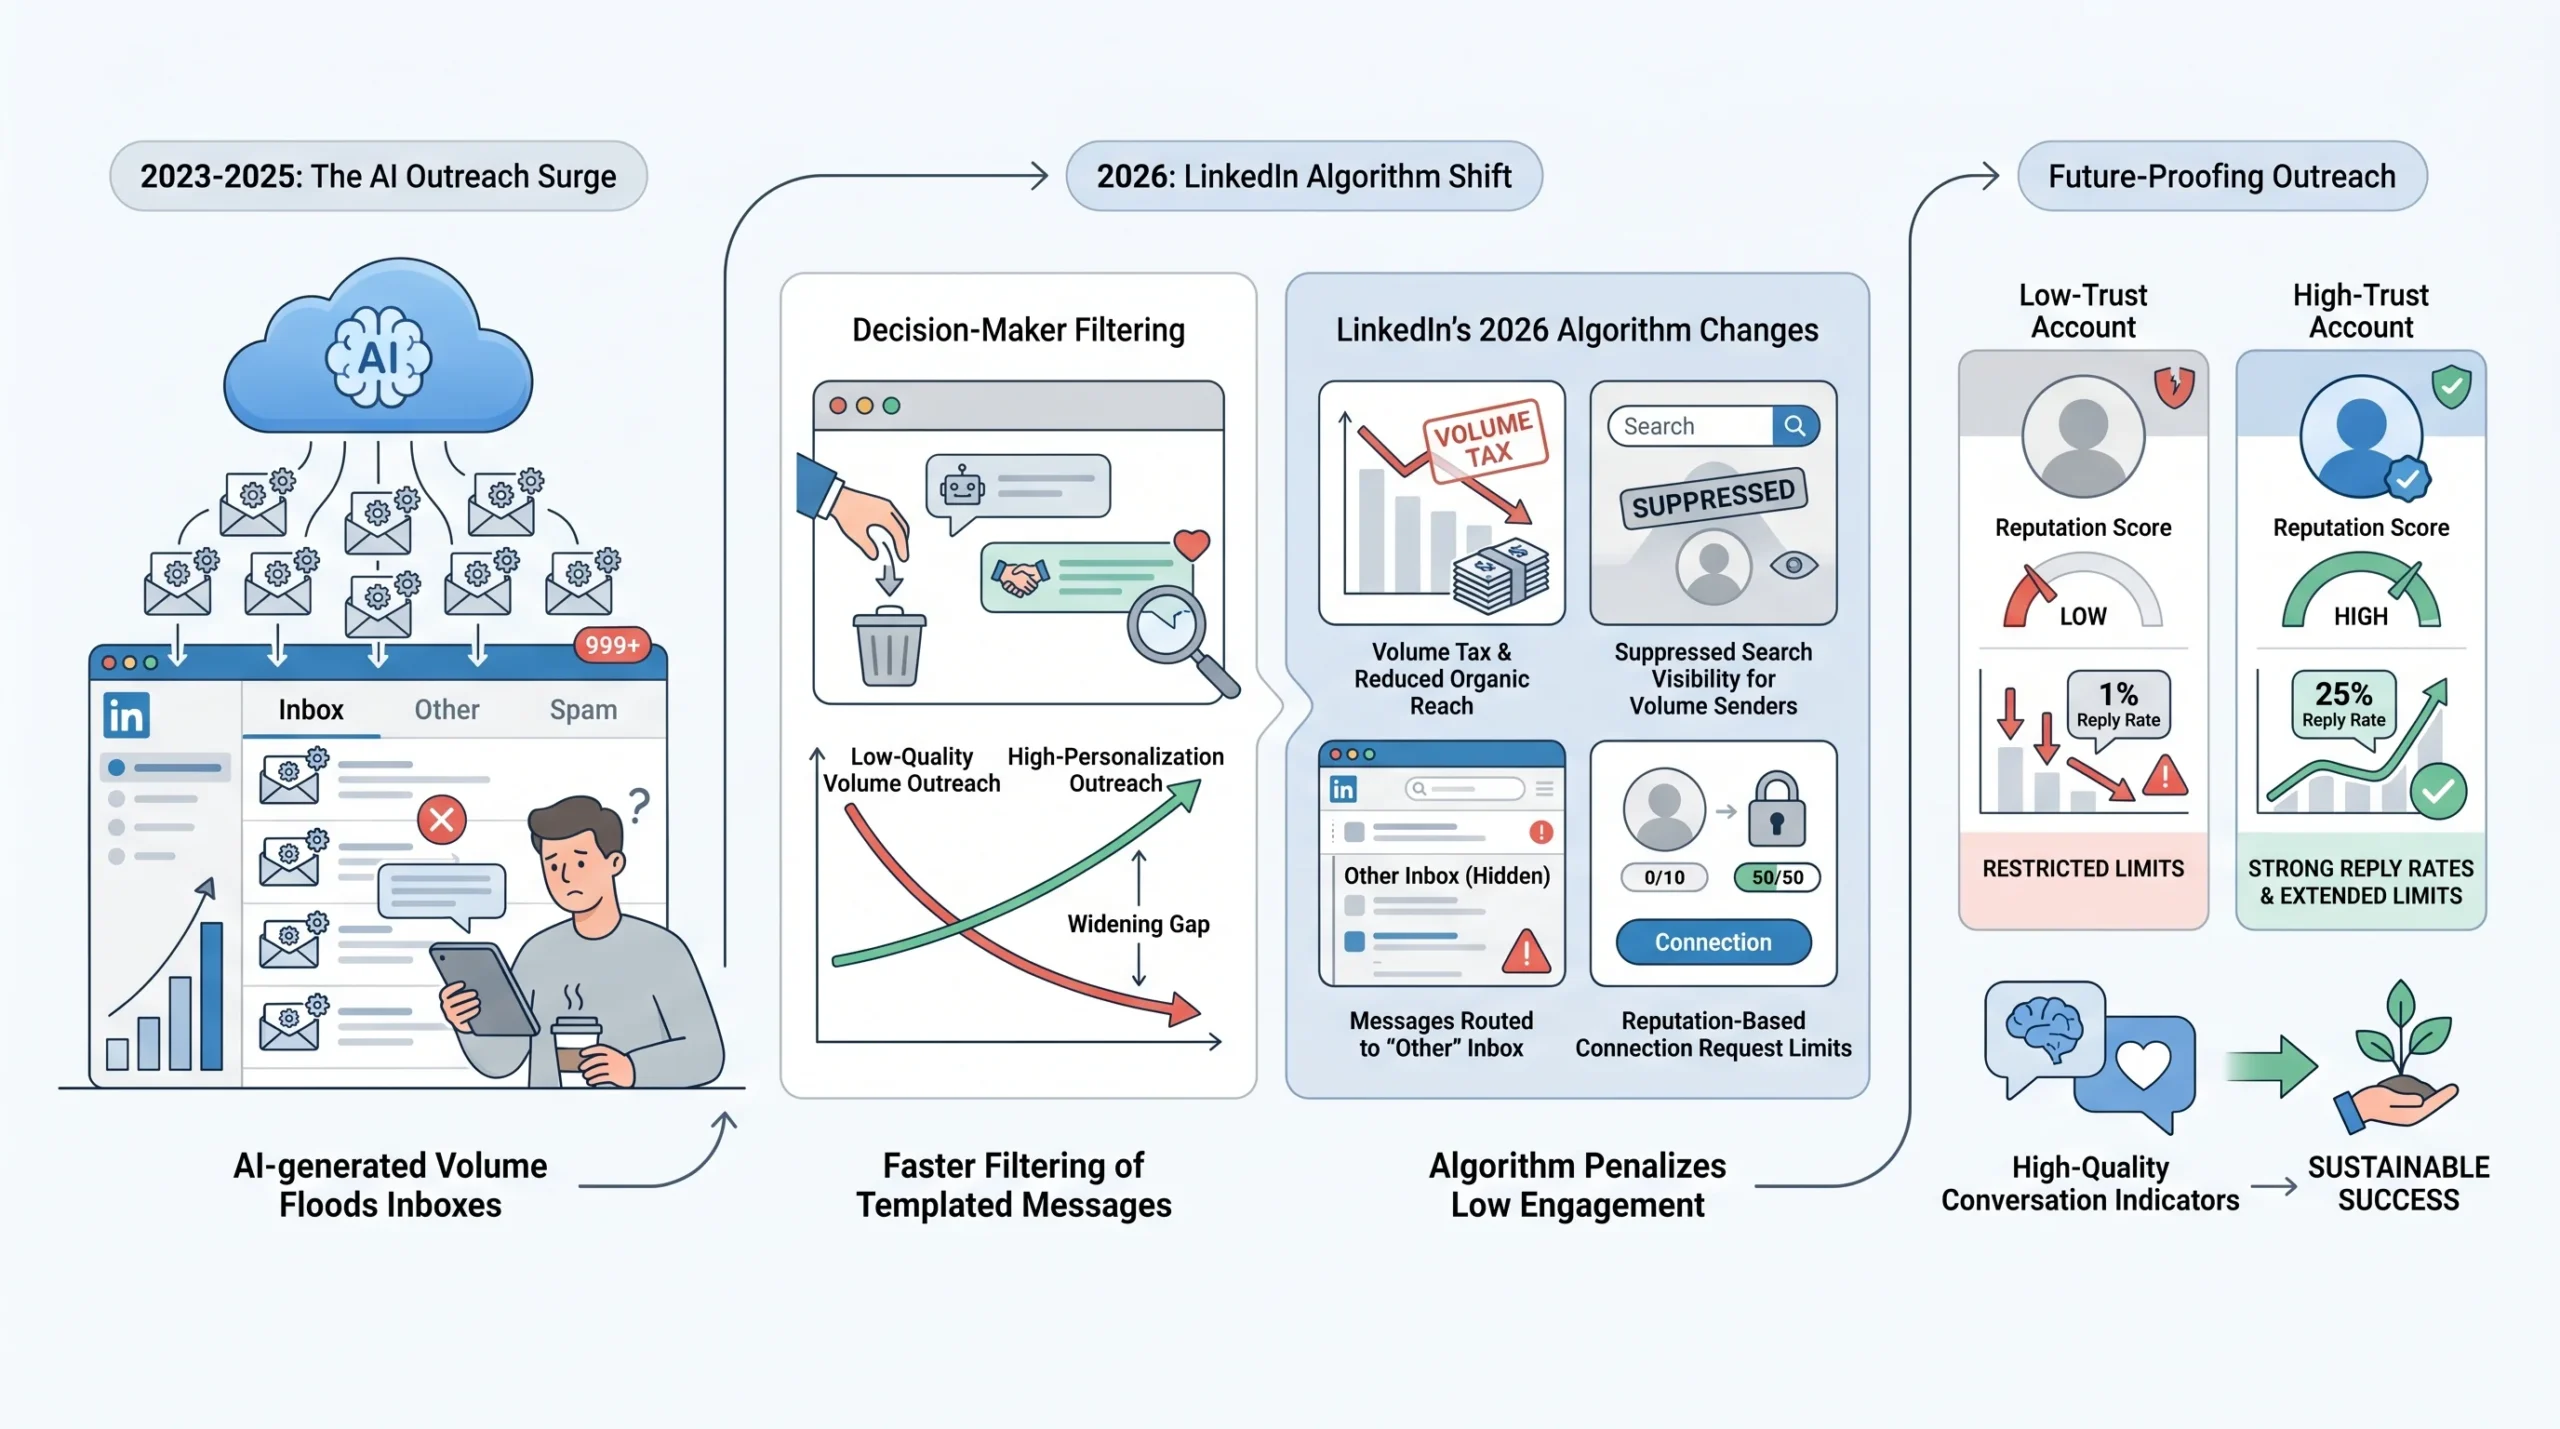
AI-generated outreach flooded inboxes and raised the “ignore” threshold. When personalized-sounding messages can be generated at zero marginal cost, recipients develop faster filters. Decision-makers who receive dozens of LinkedIn messages per week have become exceptionally good at identifying templated outreach — even when that template is AI-generated — and dismissing it before they finish the first sentence. The result is a widening gap: teams that invest in genuine personalization and warm-up strategies are seeing strong reply rates, while teams relying on volume and AI copy-paste are watching their numbers fall.
LinkedIn’s 2026 algorithm changes introduced stricter engagement quality monitoring. LinkedIn now tracks what it calls a “Volume Tax” — an internal assessment that monitors reply rates on outreach campaigns. Accounts that send high volumes of messages and receive consistently low reply rates face consequences that go beyond just poor campaign performance. Messages can be routed to the recipient’s “Other” inbox, profile reach can be suppressed in search results, and organic content distribution can be reduced. This means your reply rate is no longer just a sales metric — it is a compliance signal.
The platform tightened connection request limits. LinkedIn’s weekly connection limit is now reputation-based rather than fixed. Accounts with strong engagement histories can send up to 200 requests per week, while accounts with poor performance records can drop to as few as 50. This directly impacts the math behind volume-based outreach strategies.
What this means for how you read your own numbers. A 10% reply rate that was comfortably above average in 2023 is now a baseline expectation for well-targeted outreach. If you are benchmarking your performance against older data or against email metrics, you are measuring yourself against the wrong standard. The sections below give you the right standard for every channel, industry, role, and timing variable.
The Core Benchmark — What Is a Good LinkedIn Response Rate in 2026?
Before breaking down the nuances, the most common question deserves a direct answer: what number should you be aiming for?
The overall average LinkedIn reply rate across all outreach types is 10.3%, according to Expandi’s dataset of over 70,000 campaigns. To put that in perspective, cold email averages 5.1% — meaning LinkedIn delivers more than double the reply rate of email as a channel, even before you account for personalization or targeting quality.
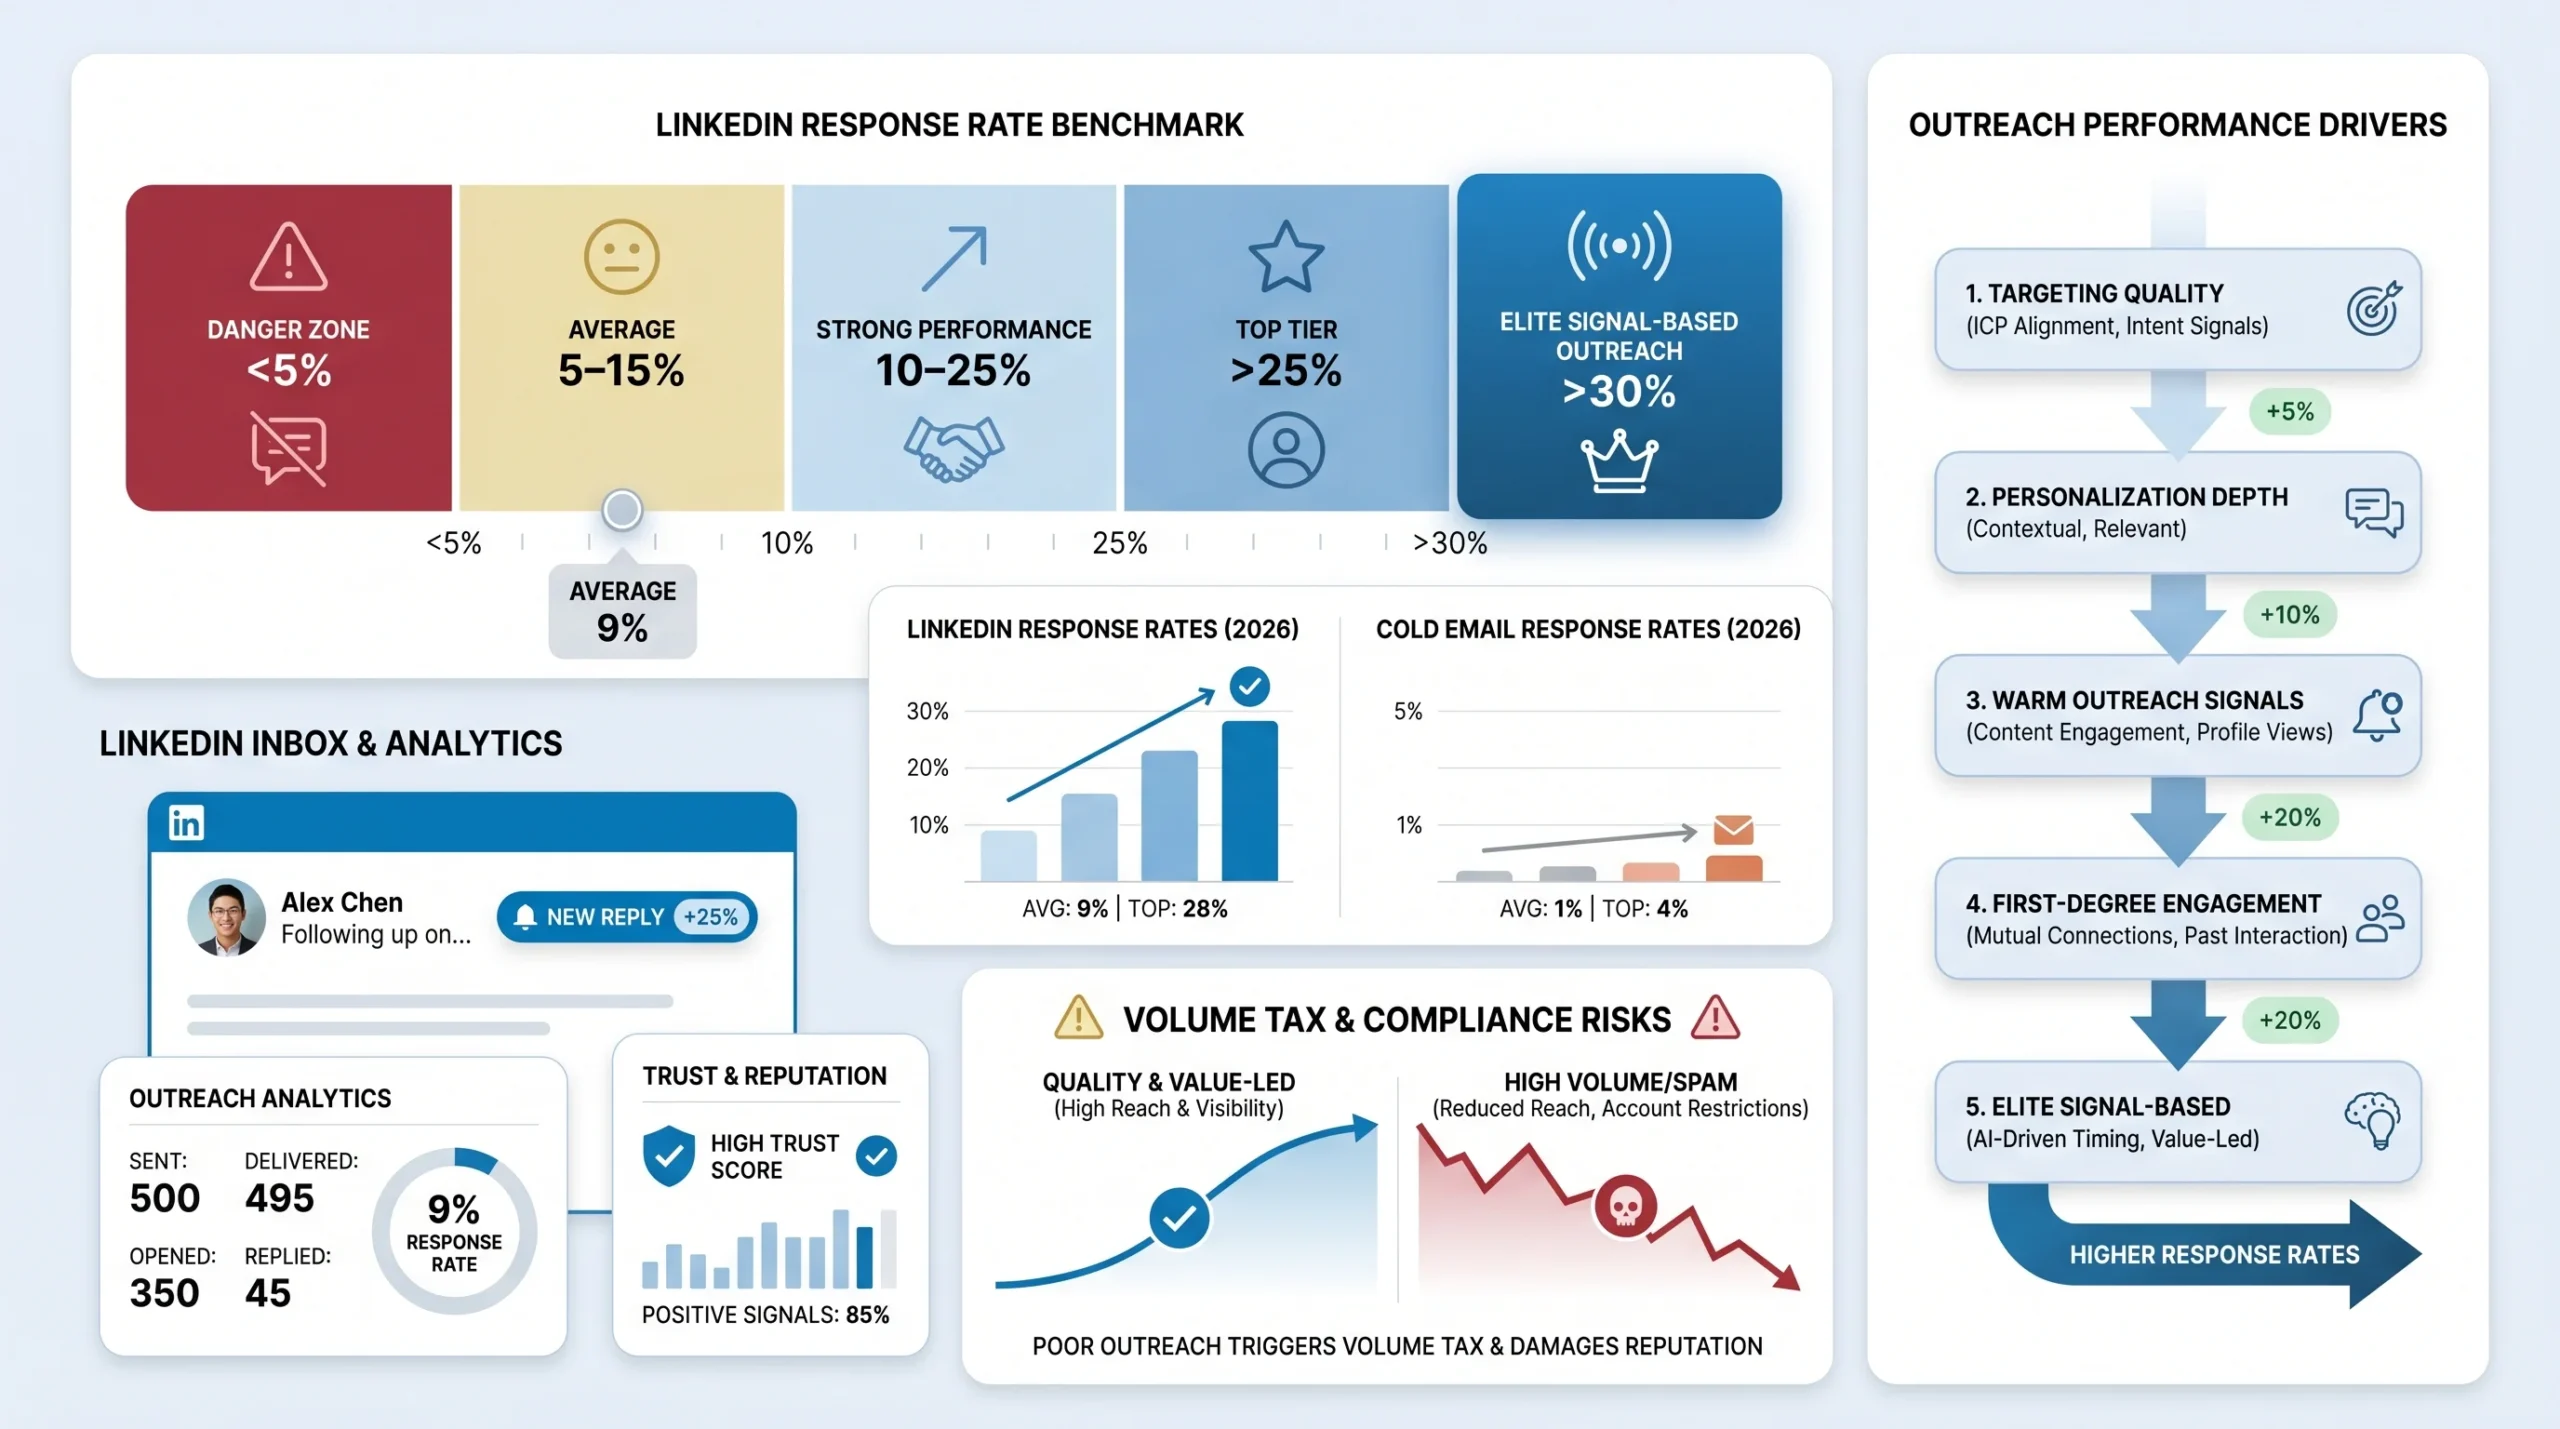
The performance tiers for LinkedIn outreach in 2026 break down as follows:
- Below 5%: Danger zone. At this level, the problem is almost never the copy. It is an audience or targeting problem. The list needs to be fixed before anything else.
- 5–15%: The average range, depending on channel, audience quality, and personalization. Landing in this band means your fundamentals are in place but there is measurable room to improve targeting, sequencing, or message relevance.
- 10–25%: Good performance. This range signals that targeting is dialed in and messaging is relevant to the audience receiving it.
- Above 25%: Top tier. Hitting this range consistently requires strong ICP definition, warm-up sequences, and genuine personalization — not just variable insertion.
- Above 30%: Elite performance, achievable primarily through signal-based outreach where prospects have already shown engagement with your content or profile before the first message is sent.
One critical nuance in 2026: “good” is always relative to channel, industry, and the type of outreach being run. A 10% reply rate on cold InMail to SaaS executives is strong performance. A 10% reply rate on warm DMs to first-degree connections in Recruiting is below average. The sections below give you the right benchmark for each context.
There is also a compliance dimension to reply rate that most guides ignore. LinkedIn’s engagement quality monitoring tracks reply rates silently — no notification, no warning — as part of its Volume Tax assessment. Accounts sending high volumes of outreach with reply rates consistently below 10–15% risk having messages routed to the “Other” inbox, profile reach suppressed in search results, and organic content distribution reduced. Reply rate is not just a performance metric. It is how LinkedIn decides whether your account is adding value to the platform or degrading it.
LinkedIn Response Rate by Channel — InMail vs DM vs Connection Request
The single biggest variable in LinkedIn response rate is not your message — it is the channel you use to deliver it. InMail, direct messages to first-degree connections, and connection request sequences have meaningfully different mechanics, different costs, and different benchmark ranges. Choosing the wrong channel for a given audience is one of the most common reasons LinkedIn outreach underperforms.
LinkedIn Direct Messages (DMs to First-Degree Connections)
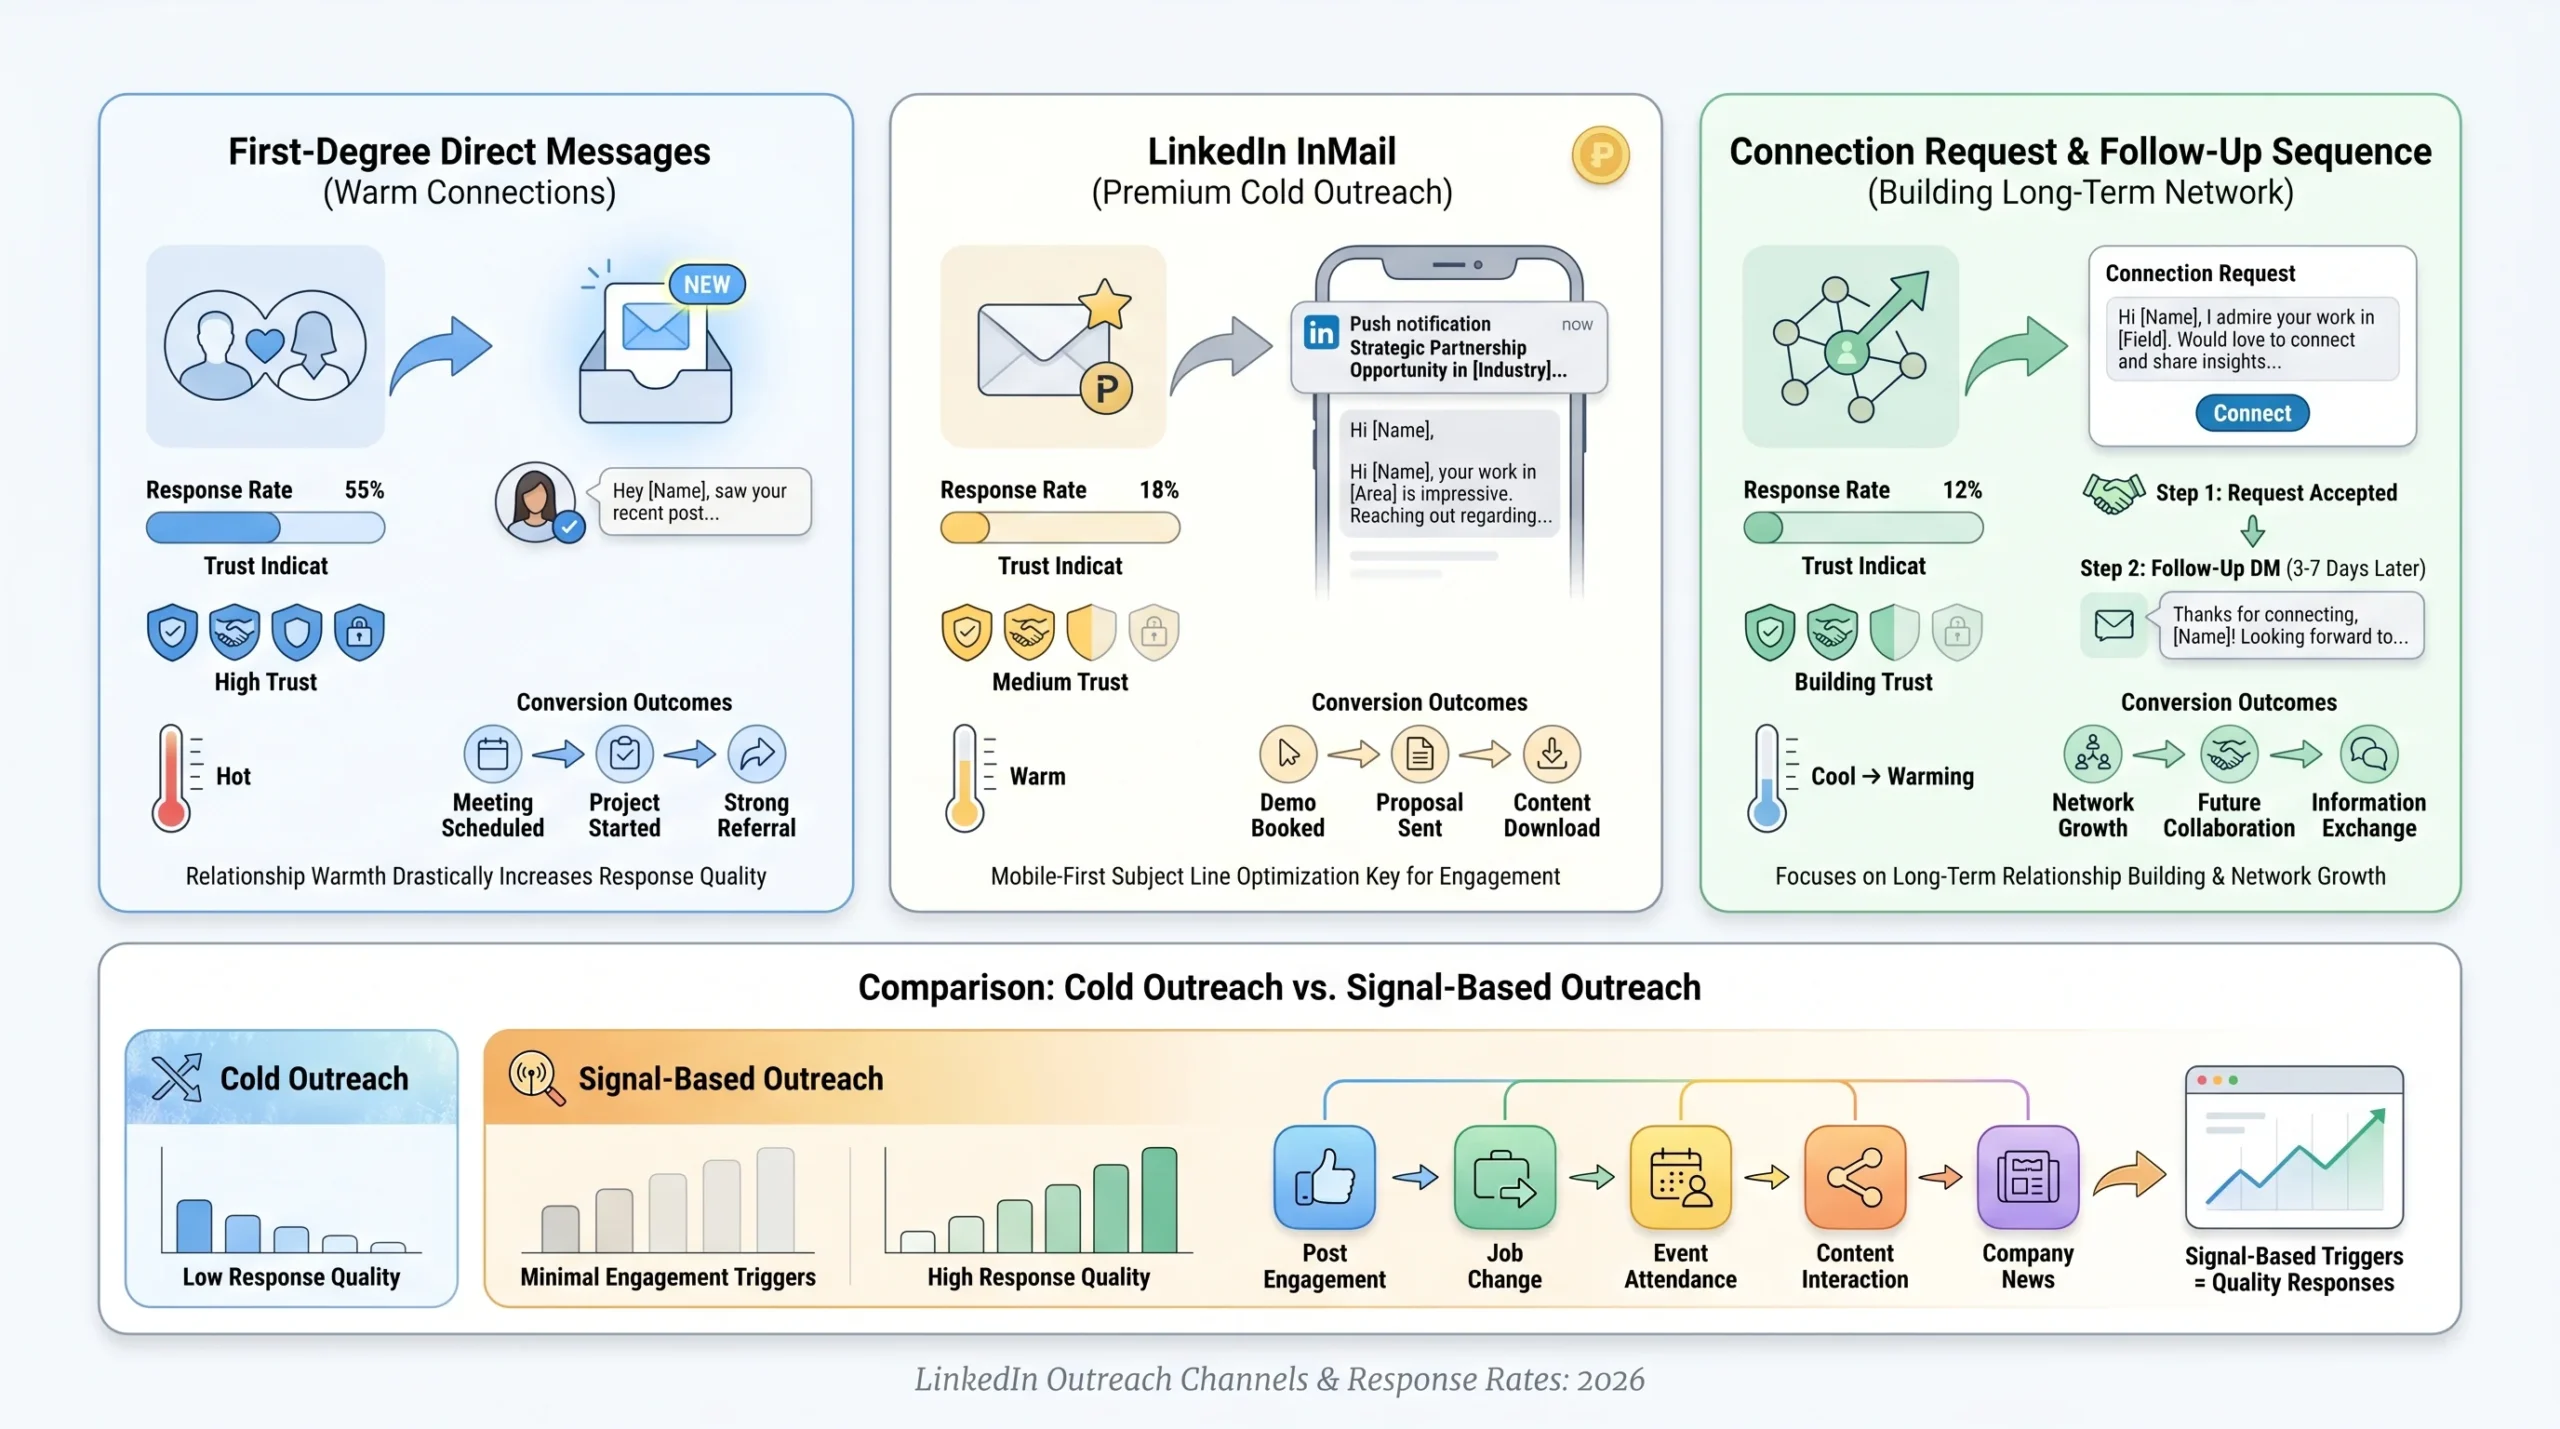
Direct messages sent to your existing first-degree connections are the highest-converting channel for ongoing outreach, primarily because the relationship foundation already exists. Messenger campaigns — the term used for automated DM sequences targeting first-degree connections — achieve an average reply rate of 16.86%, according to Expandi’s dataset. That is comfortably above the 10.3% all-channel average and reflects the structural advantage of messaging people who already know your name and face.
The reason this channel performs well is straightforward: the recipient’s friction is lower. They have already accepted a connection with you, which means they have implicitly acknowledged your existence in their professional network. A message from a first-degree connection feels less like a cold intrusion and more like a continuation of a relationship, even if that relationship is still early.
The practical implication is that building a strong first-degree network of well-targeted prospects — and then messaging them through Messenger campaigns — should be the foundation of any LinkedIn outreach strategy before InMail credits are deployed.
LinkedIn InMail
InMail is LinkedIn’s premium direct messaging channel, available to paid accounts (Premium, Sales Navigator, Recruiter). It allows you to message any LinkedIn member regardless of connection status, bypassing the connection request step entirely.
The overall average InMail response rate sits at 6.38%, with all responses in the Belkins 2025 study coming from the first message — which highlights a structural limitation of InMail: it is essentially a one-shot opportunity. If the recipient does not reply to your first InMail, the engagement path ends there unless you invest additional credits in a follow-up.
However, that 6.38% overall average masks a significant performance range. Premium, well-targeted InMail campaigns from high performers reach 18–25% response rates, and top performers with strong personalization and signal-based targeting cross 30–40%. The gap between 6% and 30% is not luck — it is the difference between cold, generic InMail and contextually relevant messages sent to prospects who are primed to receive them.
Two factors with the biggest mechanical impact on InMail response rate:
- Message length: Messages under 400 characters get 22% higher response rates than longer ones. Executives read InMails on their phones between meetings. Brevity signals respect for their time.
- Subject line: The optimal InMail subject line length is 16–27 characters (roughly 3–5 words), which produces the highest open rates. Mobile devices cut off subject lines at 30–40 characters, so front-loading the hook in the first 25 characters is essential.
InMail also has a credit refund mechanic worth understanding: if a recipient replies within 90 days, LinkedIn automatically refunds the InMail credit. This means well-crafted, targeted InMails that generate replies effectively cost nothing, while spray-and-pray InMail campaigns bleed credits with no return.
InMail open rates reach 50–60%, compared to cold email’s 15–27%. The delivery advantage is real. Low InMail reply rates are almost never a deliverability problem — they are a messaging relevance problem.
Connection Request + Follow-Up DM (The Warm Pipeline)
The two-step approach — sending a personalized connection request, waiting for acceptance, then following up with a DM — is the channel that most consistently outperforms cold InMail over the full funnel when executed with a warm-up strategy.
A good LinkedIn connection acceptance rate in 2026 ranges from 30–45% for well-targeted cold outreach. Warm connection requests sent from a recognizable name — someone whose content the prospect has seen or who has engaged with their posts — frequently hit 40–60% acceptance. And once connected, the subsequent warm DM response rate runs 15–25%, with engaged connections responding at even higher rates.
When you combine both steps — acceptance rate multiplied by subsequent reply rate — the math typically favors the warm pipeline over cold InMail on total pipeline generated, at zero additional cost (connection requests are free on all LinkedIn accounts).
The channel also has a compounding advantage that InMail does not: an accepted connection request adds the prospect permanently to your first-degree network. They will see your future posts in their feed, building familiarity over time. InMail creates a conversation but not a network relationship.
Cold Outreach vs. Signal-Based (Warm) Outreach — The Biggest Variable
Across every LinkedIn outreach channel, the single most impactful variable is whether the outreach is cold or warm. Including a personalized message in a connection request significantly boosts the reply rate — 9.36% compared to 5.44% for requests sent without a note. That is a 72% lift from a single personalization decision.
Signal-based outreach — where the message references a specific trigger (a prospect liked a post you wrote, changed jobs, commented on a peer’s content, or attended a LinkedIn event) — consistently outperforms generic outreach across every channel. The mechanism is simple: when a prospect can see exactly why you are reaching out at this specific moment, the message feels relevant rather than random.
LinkedIn Response Rate by Industry
Industry is one of the strongest predictors of LinkedIn response rate, and the variation is substantial. A reply rate that represents strong performance in one vertical can signal a serious problem in another. Understanding your industry benchmark before evaluating your campaign performance is essential.
Here is what the data from Expandi’s 20 million+ outreach attempt dataset shows:
- Recruiting & HR: 18–25% average reply rate. This is the highest-performing industry for LinkedIn outreach. Recruiting professionals are structurally accustomed to networking conversations and tend to be more open to new connections and outreach than other verticals.
- Legal & Professional Services: 10.42%. The highest-performing non-recruiting industry. Professionals in this space respond well to outreach that demonstrates clear domain understanding and specific relevance to their practice area.
- Healthcare: 9.25%. Healthcare professionals are actively seeking efficiency solutions and respond to outreach that can credibly demonstrate time savings or operational improvement.
- Education, Marketing, and Construction: 7–9%. These sectors represent solid midrange performance. Response rates are achievable with good targeting and relevant messaging but require more personalization than Recruiting-level campaigns.
- Software & SaaS: 4.77%. The lowest-performing industry in the dataset. Professionals in SaaS and tech receive a higher volume of automated outreach than any other vertical, and they have developed what practitioners call “template blindness” — an almost instinctive ability to identify and ignore non-personalized messages before finishing the first sentence.
The SaaS performance floor has practical implications for anyone doing LinkedIn outreach into the tech sector. Campaigns targeting SaaS companies need significantly higher personalization investment — and should not be benchmarked against cross-industry averages. A 7% reply rate in SaaS outreach is above the industry norm. A 15% reply rate represents exceptional performance.
LinkedIn Response Rate by Job Title and Seniority
Beyond industry, seniority level is one of the strongest predictors of whether a LinkedIn message gets a reply. The pattern is consistent: the higher the title, the lower the average response rate — not because senior leaders are less engaged on LinkedIn, but because they receive more outreach and have higher filtering thresholds.
Here is what the data shows across seniority levels:
- HR & Talent Acquisition professionals: 12.08% average reply rate. This group is among the most responsive on the platform, consistent with the broader Recruiting industry performance data. Their role involves networking and vendor conversations by default.
- C-Level Executives: 6.98% average reply rate. C-suite leaders receive dozens of LinkedIn messages weekly. The threshold for a message worth their time is significantly higher than for mid-level professionals.
- Directors and VPs: Sit between these two endpoints, typically in the 8–10% range for well-targeted cold outreach.
- Individual contributors and managers: Generally more responsive than senior leaders, with reply rates tracking toward the 10–15% range for relevant, personalized outreach.
The practical implication for message strategy is that senior leader outreach requires a different approach — not just a more polished template. C-suite messages need to be shorter, more specific, and rooted in a value proposition that is immediately visible in the first line. Generic opener lines, rapport-building preambles, and soft CTAs that work on managers will not generate replies from VPs and above.
The “gatekeeper vs. decision-maker” dynamic also matters in multi-stakeholder outreach. In many B2B sales scenarios, the person who controls the budget is not the same person who evaluates the solution. Building engagement with operational decision-makers — who have higher reply rates — often opens the door to executive conversations more reliably than cold InMail to the C-suite.
LinkedIn Response Rate by Region
Geography is a meaningful but frequently overlooked variable in LinkedIn outreach benchmarking. Reply rates vary significantly across global regions, and teams running international outreach should be measuring their campaigns against regional baselines — not a single global average.
The Expandi dataset, which covers outreach across 80+ countries, shows the following regional breakdown:
- Southern Europe: 11.81% reply rate — the highest of any global region. Countries including Italy, Spain, and Portugal are consistently the most responsive to LinkedIn messages, outperforming all other regions in the dataset.
- South America: 9.71%. Strong engagement, particularly in Brazil and Argentina, where LinkedIn adoption among business professionals is growing rapidly.
- Northern Europe: 9.41%. The UK, Netherlands, Sweden, and the Nordics show solid professional engagement, with higher expectations for personalization and value demonstration.
- Australia & Oceania: 8.83%. Consistent mid-range performers, with Australia showing the strongest engagement within the region.
- Eastern Europe: 8.68%. Solid performance, particularly in Poland, Czech Republic, and Romania, where English-language professional networking is common.
- North America: Sits below its market size would suggest, largely due to inbox saturation from high volumes of automated outreach. US and Canadian professionals tend to be among the most skeptical of LinkedIn outreach.
- APAC (East Asia, Southeast Asia): Lower average reply rates, with meaningful variation by country. Cultural norms around unsolicited professional contact differ, and localized messaging — including awareness of language and communication style — matters significantly more than in English-language markets.
The regional data has direct implications for how to build outreach cadences. A campaign targeting Southern European prospects can afford a slightly more direct approach. A campaign targeting North American tech executives needs to work harder on warm-up and personalization to reach the same reply rate.
LinkedIn Response Rate by Timing — Day, Time, and Season
When you send a LinkedIn message affects whether it gets a reply. The effect is not dramatic in absolute percentage terms — but at scale, even a 0.3 percentage point difference in reply rate translates to dozens of additional conversations per week for active outreach teams.
Best Days to Send
Tuesday is the strongest day for LinkedIn replies, with an average reply rate of 6.90%, followed closely by Monday at 6.85%. Wednesday and Thursday represent a midweek plateau at 6.62% and 6.63% respectively — stable but slightly lower than the early-week peak. By Friday, the reply rate drops to 6.58%, and weekends fall to 6.40% on Saturdays.
The pattern reflects a consistent behavioral dynamic: professionals engage with external messages most actively at the start of the week, when they are clearing their inboxes and planning the week ahead. As the week progresses, focus shifts toward internal work and deliverables, leaving less mental bandwidth for unsolicited conversations.
A note on conflicting data: SalesBread’s 2026 dataset shows Thursday as the peak day for LinkedIn replies, with Monday leading on connection acceptance. This discrepancy matters because different datasets reflect different audience segments, industries, and campaign types. The best approach is to use Tuesday and Monday as your default sending windows, then run A/B tests against your specific audience to identify your own performance peak.
Best Time of Day
The consistent top performer across studies is the morning window of 8–10 AM in the recipient’s local time zone. This aligns with the inbox-clearing behavior of professionals starting their workday — messages sent in this window arrive when the prospect is most likely to be actively reviewing their LinkedIn notifications and messages.
Mobile behavior also matters here. Over 57–70% of LinkedIn traffic happens on mobile devices. Messages sent during commute windows (7:30–9 AM) or lunch breaks are more likely to be opened on mobile — which affects how you structure your message. A long paragraph-heavy message opened on a phone screen is a message that does not get read.
Best and Worst Months
Seasonal patterns in LinkedIn outreach are real and consistent across datasets. The data from Expandi’s 20 million+ outreach attempts reveals predictable seasonal curves:
Best months for outreach:
- January (post-slump): After the first two weeks, January becomes a strong outreach month. Budget cycles reset, new goals are set, and decision-makers are receptive to conversations about solutions.
- September: The strongest month of the year for many B2B outreach teams. The summer wind-down is over, teams are back at full capacity, and business development conversations pick up pace heading into Q4 planning.
- October: Sustains strong performance from September, particularly for deals that need to close before year-end.
Lowest-performing months for outreach:
- December: The final two weeks of December are functionally dead for new outreach. Decision-makers are in holiday mode, budget conversations are concluded, and response rates fall sharply.
- August: Particularly in European markets, August sees significant drops in reply rates due to summer holidays. North America is less affected but still shows a measurable dip.
- The first two weeks of January: Despite the month’s overall strength, the first 7–14 days are slow as professionals return from the holiday break and catch up on internal priorities before engaging with external conversations.
Building seasonal cadence into annual outreach planning — concentrating effort in September–November and January–March, reducing volume in August and December — gives teams a structural advantage without requiring any change to message quality.
How AI and Personalization Affect Response Rate
Artificial intelligence has changed LinkedIn outreach in two opposite directions simultaneously. On one hand, AI tools make it easier to generate personalized-sounding messages at scale. On the other hand, as AI-generated outreach floods inboxes, the threshold for what feels genuinely personal has risen.
The data from the Expandi dataset gives a specific picture of how AI assistance affects performance at different stages of a sequence:
- First message with AI assistance: 4.19% reply rate, compared to 2.60% without AI. That is a meaningful improvement — AI-generated openers perform better than generic non-AI openers because they can reference profile-specific information more efficiently.
- Follow-up messages: Perform slightly better without AI, at 3.91% versus 3.48% with AI. The pattern suggests that as a conversation sequence progresses, the human element becomes more important than the efficiency gain from AI generation.
- Total campaign reply rate with AI: 7.66%, compared to 6.50% without AI. Across the full sequence, AI assistance produces a net positive result.
The strategic implication is clear: AI works best as a personalization accelerator for first touches, not as a replacement for human judgment in follow-up. Sales reps who use AI-generated messages as a starting point and then layer in contextual, human details — referencing something the prospect posted, a company milestone, or a shared industry challenge — outperform both pure AI and pure manual approaches.
The most effective personalization triggers in 2026 are signal-based: a prospect liked a post you wrote, changed jobs in the past 30 days, commented on content in your industry, attended a LinkedIn Live event, or appeared in a funding announcement. These signals give you a specific, credible reason to reach out — and credible reasons generate replies.
How Follow-Up Sequences Impact Response Rate
One of the most consistent findings across LinkedIn outreach research is that single-touch outreach is structurally underperforming. Prospects do not ignore messages because they are uninterested. They ignore them because they are busy, distracted, or simply did not see the message at the right moment. A follow-up sequence respects that reality.
Multi-step outreach sequences with 2–3 follow-up messages can boost response rates to 20–30%+, compared to the 10.3% average for single-touch campaigns. The gains come not from pestering prospects but from increasing the probability that at least one message lands at the right moment.
The Expandi dataset’s builder campaign data — which covers sequences that include nurturing actions before and between messages — shows how each warm action affects the overall engagement rate:
- Single-action campaigns (connection request only, or single DM): 4.88% reply rate. This is the baseline for cold, single-touch outreach.
- 2-action campaigns: Meaningfully higher reply rates, driven by the sequencing of a connection request followed by a contextual DM.
- Builder campaigns (multi-step sequences with profile views, post likes, and comments interspersed between messages): 7.22% reply rate with a 22% connection approval rate — significantly above cold-only benchmarks.
The nurturing actions — viewing a prospect’s profile, liking one of their posts, leaving a thoughtful comment on their content — serve as warm-up signals before the first message arrives. When a prospect has seen your name in their notifications three times over two weeks, your connection request feels like a natural next step rather than a cold intrusion.
The optimal number of follow-ups before diminishing returns is 2–3 for most LinkedIn outreach campaigns. Beyond that, additional messages tend to produce minimal incremental replies while increasing the risk of being marked as spam. The follow-up cadence matters too: spacing messages 3–5 business days apart gives prospects time to respond without allowing momentum to dissipate.
What a Below-Benchmark Response Rate Is Actually Telling You
A low reply rate is a signal, not a verdict. The most efficient response is to diagnose the specific failure point rather than making wholesale changes and hoping something sticks. Each performance band has a most likely root cause.
- Below 5%: Almost always an audience problem, not a messaging problem. The ICP definition is too broad, the list is sourced from low-quality data, or the targeting criteria are misaligned with who actually buys. Fix the list before you fix the copy. Rewriting messages for the wrong audience will not move the needle.
- 5–10%: Typically a messaging relevance issue. The ICP is approximately right, but the message is not specific enough to feel personal. Review whether your opener references something real and specific about the prospect, and whether your value proposition speaks to a problem they actually have rather than a problem you assume they have.
- 10–15%: Solid baseline performance. At this level, the fundamentals are working. The highest-leverage improvements are personalization depth (going beyond name and company to reference specific signals) and timing optimization (testing day-of-week and time-of-day variables).
- 15–25%: Strong performance. The focus should be on maintaining quality as volume scales — this range is where campaigns most often degrade when teams try to increase throughput without increasing personalization investment proportionally.
There is also a compliance dimension to below-benchmark reply rates that deserves direct attention. LinkedIn’s 2026 engagement quality monitoring tracks reply rates silently as part of its Volume Tax assessment. Accounts sending high-volume outreach with reply rates consistently below 10–15% risk having messages routed to the “Other” inbox, profile reach suppressed in search results, and organic content distribution reduced. A low reply rate does not just hurt your pipeline — it can degrade the health of the LinkedIn account itself, creating a compounding problem over time.
A useful five-question diagnostic for any underperforming campaign: (1) Is my ICP definition specific enough to identify 500 or fewer prospects? (2) Does my first message reference something specific about this individual? (3) Am I sending to decision-makers or recommenders? (4) Is my CTA asking for one action, clearly stated? (5) Am I sending during the early-week, morning window?
LinkedIn Response Rate vs. Other Channels — Is LinkedIn Still Worth It?
With the investment required to run high-quality LinkedIn outreach — personalization, warm-up sequences, Sales Navigator costs — it is a legitimate question whether the channel justifies the effort compared to alternatives.
The data makes a clear case for LinkedIn as the primary B2B outreach channel in 2026.
LinkedIn direct messages average a 10.3% reply rate versus cold email’s 5.1% — more than double the return from the same outreach effort. LinkedIn InMail at its average performance level (18–25% for personalized campaigns) is outperforming cold email by a factor of 4–5x.
The open rate advantage is equally significant. InMail open rates reach 50–60%, compared to cold email’s 15–27%. And unlike email, InMail deliverability is nearly 100% — messages do not bounce or land in spam folders.
The omnichannel case is the strongest argument of all. Combining InMail with other channels — email, phone, and LinkedIn content engagement — increases engagement by 287% compared to single-channel approaches. LinkedIn does not replace email or phone. It amplifies them. A prospect who has seen your LinkedIn content, accepted your connection, and then receives an email from you is significantly more likely to reply to that email than someone receiving it cold.
LinkedIn also drives 75–85% of all B2B social media leads, according to multiple research studies. For B2B teams prioritizing quality pipeline over volume, the channel’s structural advantages — credibility signals, mutual connections, content visibility, and professional context — are not replicated by any other platform.
The ROI argument ultimately comes down to cost per conversation, not cost per send. LinkedIn requires more effort per message than mass email, but it generates far more conversations per message sent. For most B2B outreach contexts, that trade is strongly favorable.
Quick-Reference Benchmark Table
The following table consolidates the core benchmarks from this guide into a single reference.
| Channel / Variable | Average Rate | Good Rate | Top Tier |
|---|---|---|---|
| LinkedIn DMs (all outreach types) | 10.3% | 15–20% | 25%+ |
| Messenger campaigns (1st-degree connections) | 16.86% | 20–25% | 30%+ |
| InMail (cold, unoptimized) | 6.38% | 10–15% | 18–25% |
| InMail (personalized, targeted) | 18–25% | 25–30% | 30–40% |
| Connection acceptance rate | ~29–30% | 35–40% | 45%+ |
| Recruiting & HR (highest industry) | 18–25% | — | — |
| Software & SaaS (lowest industry) | 4.77% | — | — |
| Best day (Tuesday) | 6.90% reply rate | — | — |
| AI-assisted first message | 4.19% | — | — |
| AI-assisted total campaign | 7.66% | — | — |
| Single-action DM campaigns | 4.88% | — | — |
| Builder campaigns (multi-step + nurturing) | 7.22% | — | — |
| Cold email (for comparison) | 5.1% | — | — |
Key Takeaways
LinkedIn outreach response rates in 2026 are higher than any other B2B outreach channel — but only for teams who understand the variables that drive them. The overall cross-channel average of 10.3% masks meaningful variation by channel (6.38% for cold InMail versus 16.86% for first-degree DM campaigns), by industry (4.77% in SaaS versus 18–25% in Recruiting), by region (4.77% in tech-saturated markets versus 11.81% in Southern Europe), and by timing (Tuesday morning outreach consistently outperforming Friday and weekend sends).
The three levers with the highest measurable impact on LinkedIn reply rate are: channel selection (warm DMs to first-degree connections outperform cold InMail structurally), personalization depth (signal-based outreach that references specific triggers generates reply rates 72% or more above generic messages), and warm-up sequences before the first message (builder campaigns with nurturing actions achieve 7.22% reply rates versus 4.88% for single-action cold outreach). Investing in all three — and measuring reply rate by channel and industry segment rather than in aggregate — gives outreach teams both the performance improvement and the diagnostic clarity to know exactly what to fix when numbers fall below benchmark.
Frequently Asked Questions
What is a good LinkedIn response rate in 2026?
A good LinkedIn response rate in 2026 depends on the channel being used. For direct messages to first-degree connections, a good rate is 15–20%, with top performers reaching 25%+. For cold InMail, the average across all campaigns is 6.38%, but personalized InMail campaigns from strong performers reach 18–25%. The overall cross-channel average for all LinkedIn outreach types is 10.3%. Anything below 5% — regardless of channel — indicates an audience or targeting problem that needs to be addressed before volume is increased.
Is LinkedIn InMail or a connection request better for outreach?
It depends on the audience and the objective. Cold InMail reaches anyone immediately, without requiring acceptance, which makes it useful for high-value prospects who are unlikely to accept a cold connection request (particularly C-suite executives). However, warm connection requests — sent to prospects who have seen your content or with whom you have engaged — frequently achieve 40–60% acceptance rates, and the subsequent DM response rate runs 15–25%. When you combine both steps, the warm pipeline approach typically outperforms cold InMail on total pipeline generated at zero additional cost. InMail is best reserved for high-priority prospects who are outside your reachable network or for time-sensitive outreach where waiting for connection acceptance is not an option.
Why is my LinkedIn reply rate below 5%?
A reply rate below 5% is almost never a wording problem. The most common causes are: (1) the target list is too broad or sourced from low-quality data, meaning the messages are reaching people who have no real reason to respond; (2) the messaging is generic and does not reference anything specific about the prospect or their context; (3) outreach is being sent to the wrong person in the buying committee — reaching recommenders instead of decision-makers, or vice versa. The fix should start with the list, not the copy.
Does LinkedIn penalize accounts with low response rates?
Yes, indirectly. LinkedIn’s 2026 engagement quality monitoring tracks reply rates as part of its Volume Tax assessment. Accounts that consistently generate low reply rates from high-volume outreach face consequences that include messages being routed to the recipient’s “Other” inbox (reducing visibility), profile reach being suppressed in search results, and organic content distribution being reduced. These penalties are applied silently — there is no notification or warning. Maintaining a reply rate above 10–15% is not just a performance target; it is also how you protect the health of your LinkedIn account.
How does personalization affect LinkedIn reply rates?
The impact of personalization is substantial and well-documented across multiple datasets. Including a personalized message in a connection request boosts the reply rate to 9.36% compared to 5.44% for requests sent without a note — a 72% improvement. AI-assisted first messages achieve a 4.19% reply rate versus 2.60% for non-AI messages, but the most effective approach combines AI efficiency with human judgment: using AI to draft personalized openers based on profile data and then layering in specific, contextual details about the prospect’s recent activity, job change, or company news.
What industries have the highest LinkedIn outreach response rates?
Recruiting and HR leads all industries with an average reply rate of 18–25%, followed by Legal and Professional Services at 10.42% and Healthcare at 9.25%. Education, Marketing, and Construction typically fall in the 7–9% range. Software and SaaS is the lowest-performing industry at 4.77%, due to the high volume of automated outreach that professionals in this space receive. Industry benchmarks should be used as the reference point when evaluating campaign performance — comparing SaaS outreach to Recruiting benchmarks will produce a misleading picture of campaign health.
How many follow-ups should I send on LinkedIn?
The data consistently supports 2–3 follow-up messages as the optimal range for LinkedIn outreach sequences, with messages spaced 3–5 business days apart. Multi-step sequences with 2–3 follow-ups can boost response rates to 20–30%+, compared to the 10.3% average for single-touch outreach. Beyond 3 follow-ups, the incremental reply rate gain diminishes significantly, and the risk of being marked as spam or triggering LinkedIn’s spam detection systems increases. Builder campaigns that include warm-up actions (profile views, post likes, comments) between messages perform better than message-only sequences at the same number of touches.