
LinkedIn outreach has fundamentally changed how B2B sales teams generate pipeline. What started as a platform for professional networking has evolved into the most important prospecting channel for sales teams, recruiters, and founders across virtually every industry.
But here’s the challenge that every sales professional faces in 2026: LinkedIn’s effectiveness varies enormously depending on how you use it. A sales rep running poorly personalized connection requests at high volume might see a 10% acceptance rate and near-zero replies. A founder running thoughtfully personalized, well-timed outreach to a precisely defined audience might see 60% acceptance rates and reply rates that turn their LinkedIn into a consistent pipeline engine.
The difference between those two outcomes isn’t luck. It’s strategy, execution, and understanding what the data actually says about what works on this platform.
This guide compiles the most comprehensive LinkedIn outreach statistics 2026 available, covering connection request acceptance rates, message reply rates, InMail performance, content engagement, the impact of personalization, and everything you need to benchmark your own outreach against what’s actually working across the platform right now.
Whether you’re evaluating your current LinkedIn outreach strategy, building a new one, or trying to understand why your numbers aren’t matching your effort the data in this guide tells the full story.
LinkedIn’s Platform Scale in 2026: The Context Behind the Numbers
Before diving into outreach-specific statistics, understanding the scale and composition of LinkedIn’s user base in 2026 provides essential context for interpreting every metric that follows.
LinkedIn has crossed one billion registered members globally. But raw membership numbers don’t tell the operational story for B2B outreach. What matters is active usage, how many of those billion members are on the platform regularly, engaging with content, accepting connection requests, and opening messages.
LinkedIn Platform Statistics 2026
| Metric | Statistic |
|---|---|
| Total registered members | 1 billion+ |
| Monthly active users | ~310 million |
| Daily active users | ~134 million |
| Posts, articles, and videos published weekly | 150,000+ |
| Percentage of B2B social media leads from LinkedIn | 80%+ |
| Percentage of B2B marketers who say LinkedIn produces leads | 93% |
| Countries with LinkedIn presence | 200+ |
| LinkedIn’s share of B2B display advertising | 25%+ |
| Professionals joining per minute | ~3 new members |
The gap between one billion registered members and 134 million daily active users is the most important number in this table for outreach purposes. It means that on any given day, roughly 13% of LinkedIn’s total membership is actually on the platform. This has significant implications for connection request timing, message send timing, and follow-up sequence design.
The 80%+ share of B2B social media leads attributed to LinkedIn is perhaps the most compelling statistic for sales teams. No other platform comes close for B2B prospecting — LinkedIn’s professional intent context creates a fundamentally different engagement environment than Twitter, Facebook, or Instagram.
The Real LinkedIn Outreach Statistics 2026: Connection Request Data
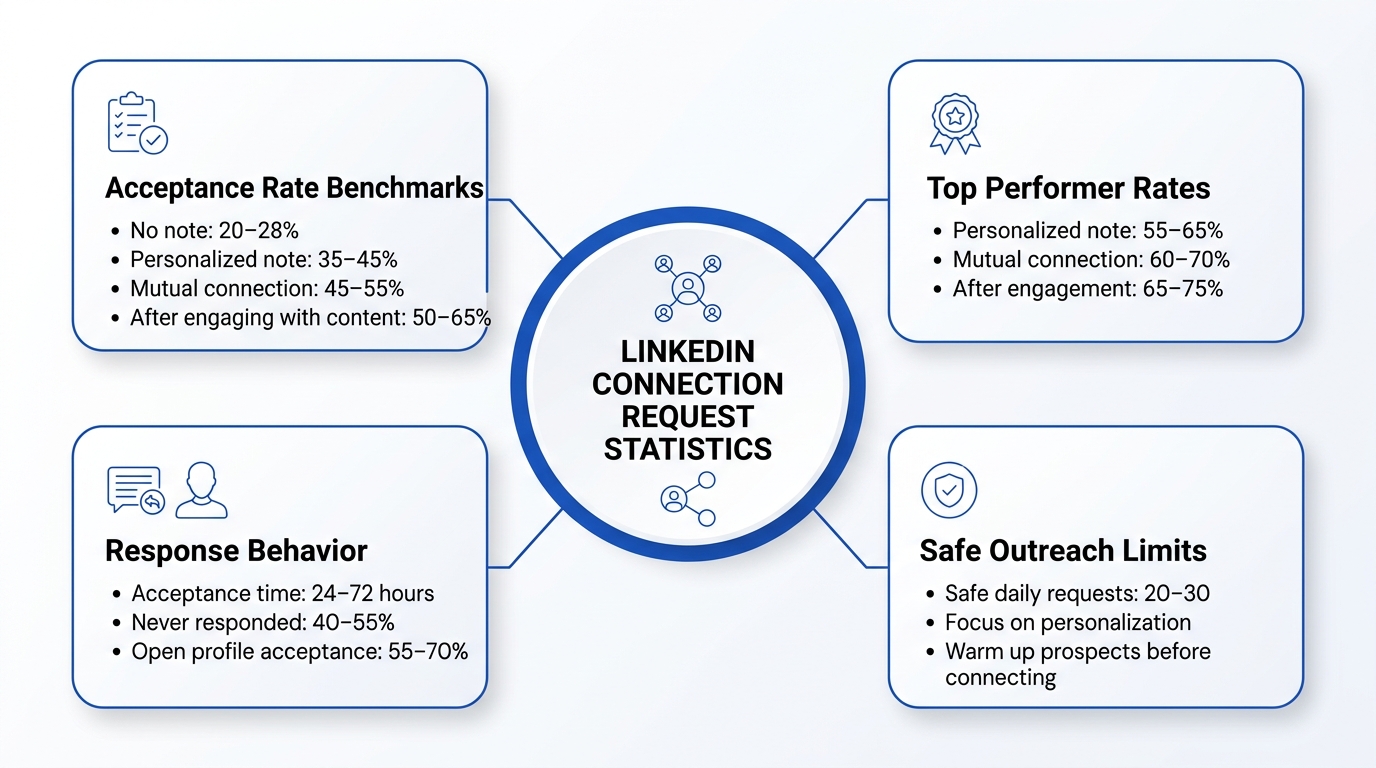
Connection requests are the foundation of LinkedIn outreach. Everything downstream — messages, conversations, meetings — depends on whether your connection requests get accepted. Understanding acceptance rate benchmarks is essential for diagnosing whether your top-of-funnel LinkedIn activity is working.
LinkedIn Connection Request Statistics
| Metric | Benchmark | Top Performers |
|---|---|---|
| Average acceptance rate (no note) | 20–28% | — |
| Average acceptance rate (personalized note) | 35–45% | 55–65% |
| Average acceptance rate (mutual connection mentioned) | 45–55% | 60–70% |
| Average acceptance rate (after engaging with their content) | 50–65% | 65–75% |
| Acceptance rate for requests to open profile members | 55–70% | — |
| Typical time for request to be accepted (when accepted) | 24–72 hours | — |
| Percentage of requests that are never responded to | 40–55% | — |
| Safe daily connection request limit (cloud-based tools) | 20–30 | — |
The difference between a 20% acceptance rate and a 55% acceptance rate represents the entire gap between a LinkedIn outreach strategy that wastes time and one that generates consistent pipeline. That gap is driven almost entirely by three factors: personalization quality, targeting precision, and pre-connection warmup.
The warmup effect is one of the most consistently validated findings in LinkedIn outreach research. Engaging with a prospect’s content — liking a post, leaving a thoughtful comment — before sending a connection request increases acceptance rates by 20–30 percentage points on average. The mechanism is straightforward: when someone sees your profile in their notifications before your connection request arrives, you’re no longer a complete stranger. Familiarity, even from one interaction, dramatically increases trust.
Connection note vs. no note debate
This has been one of LinkedIn’s longest-running tactical debates. The data in 2026 is nuanced. For cold outreach to mid-level professionals, personalized notes consistently outperform no notes — particularly when the note references something specific about the prospect’s work, a shared connection, or a relevant piece of content they’ve published. Generic notes (“Hi, I’d like to connect”) perform slightly worse than no note at all — because they signal automation without any personalization benefit.
The rule: no note is better than a generic note. A specific, genuine note is better than both.
LinkedIn Message Reply Rate Statistics: What the Data Shows
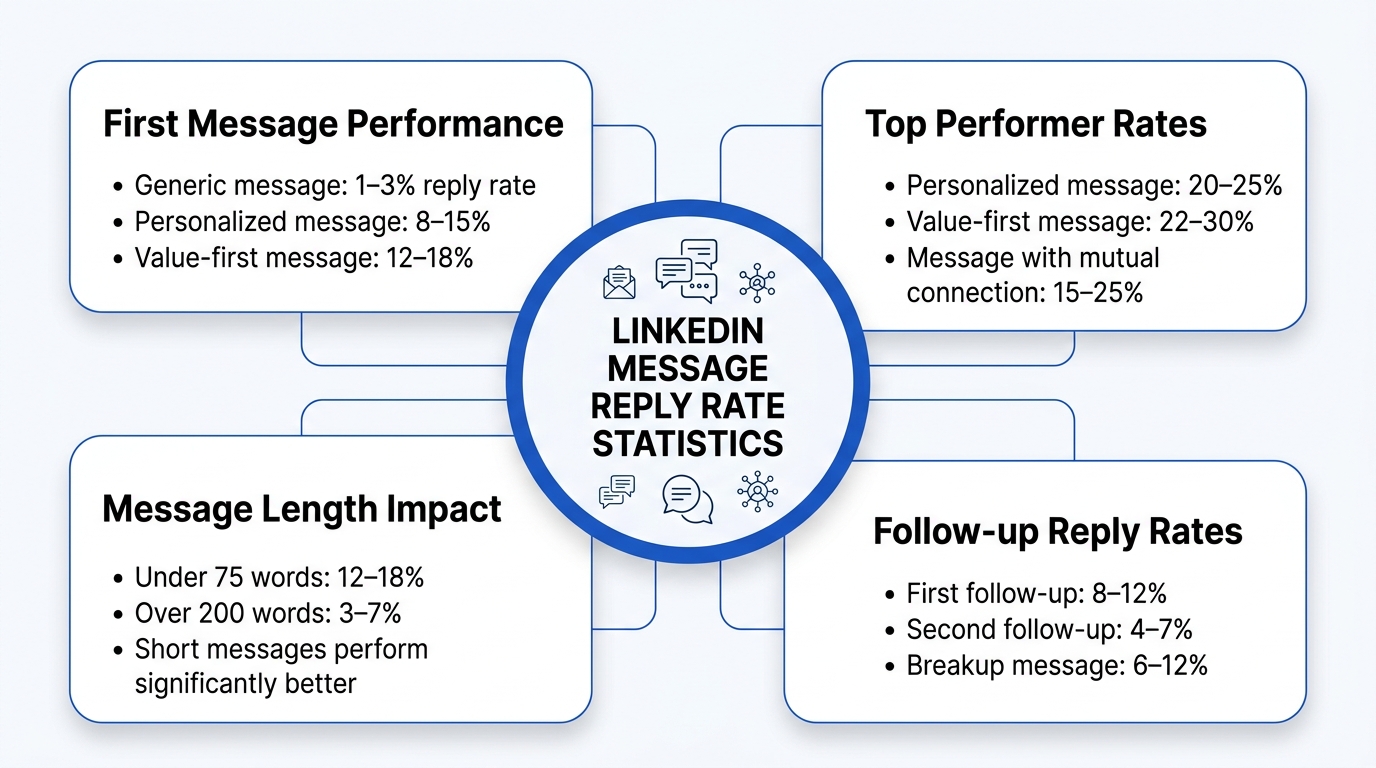
Once a connection is established, the message reply rate becomes the primary performance metric. This is where most LinkedIn outreach strategies fall apart — reply rates on LinkedIn messages are dramatically affected by message length, personalization level, value offered, and timing.
LinkedIn Direct Message Reply Rate Statistics
| Message Type | Average Reply Rate | Top Performer Rate |
|---|---|---|
| Generic first message (no personalization) | 1–3% | — |
| Personalized first message (specific observation) | 8–15% | 20–25% |
| Value-first message (resource or insight offered) | 12–18% | 22–30% |
| Short message under 75 words | 12–18% | — |
| Long message over 200 words | 3–7% | — |
| Message referencing mutual connection | 15–25% | — |
| Message following content engagement | 18–28% | — |
| Follow-up message (first follow-up) | 8–12% | — |
| Follow-up message (second follow-up) | 4–7% | — |
| Breakup message (final follow-up) | 6–12% | — |
The most striking data point in this table is the breakup message reply rate — often the highest in a sequence. The breakup message, which closes the loop and gives the prospect explicit permission to decline, frequently generates responses precisely because it removes all pressure. When people feel they can safely say no, they often say yes — or at minimum explain why the timing isn’t right, which opens a future conversation.
Message length is one of the most consistent predictors of reply rate. Messages under 75 words outperform messages over 200 words by a significant margin across virtually every study of LinkedIn outreach performance. The professional reading environment on LinkedIn is high-friction — decision-makers scroll quickly, read partially, and respond to messages that respect their time by getting to the point immediately.
The personalization premium is real and measurable. The gap between a 1–3% reply rate on generic messages and an 8–15% reply rate on specifically personalized messages represents a 5–10x difference in outreach ROI for the same amount of effort. The additional research time required to personalize each message is typically 3–5 minutes per prospect — and at 5–10x the reply rate, that investment is almost always justified.
LinkedIn InMail Statistics: Performance Data for Premium Outreach
InMail — LinkedIn’s premium messaging system that allows you to contact anyone regardless of connection status — represents a distinct category of outreach with its own performance benchmarks. Because InMail requires a credit investment, understanding its performance characteristics is particularly important for teams evaluating whether to invest in Sales Navigator or LinkedIn Premium.
LinkedIn InMail Performance Statistics 2026
| Metric | Benchmark |
|---|---|
| Average InMail open rate | 57–65% |
| Average InMail reply rate | 10–25% |
| InMail reply rate vs. cold email reply rate | 3x higher on average |
| Best performing InMail length | 200–400 words |
| InMail reply rate with personalized subject line | 15–25% |
| InMail reply rate with generic subject line | 5–10% |
| InMail credit refund rate (replies within 90 days) | Varies by send quality |
| Best days for InMail sends | Tuesday–Thursday |
| InMail reply rate for Open Profile members (free) | Similar to paid InMail |
The 57–65% open rate for InMail is the most significant differentiation from cold email, which averages 20–35% open rates. The professional context of LinkedIn means InMail notifications are treated with a different level of attention than inbox email — recipients are more likely to open and at minimum skim the content.
The 3x higher reply rate versus cold email is the statistic that most compellingly makes the case for LinkedIn InMail as a component of a multichannel outreach strategy. However, this premium comes with the constraint of limited credits per month — which is why InMail is most effectively deployed for high-priority prospects where the additional reply rate premium justifies the credit cost.
InMail subject line matters significantly. The 15–25% reply rate with a personalized subject line versus 5–10% with a generic one mirrors the pattern seen in cold email — specificity drives engagement. The best-performing InMail subject lines are typically 6–8 words, reference something specific about the prospect, and create enough curiosity to earn an open without resorting to clickbait.
Content Engagement Statistics: How LinkedIn Content Fuels Outreach
One of the most important developments in LinkedIn outreach strategy over the last three years is the recognition that content and direct outreach are not separate activities — they’re deeply interconnected. Sales reps who post consistently generate profile views, warm up their network, and see dramatically better results from their direct outreach because prospects recognize them before receiving a message.
LinkedIn Content Performance Statistics 2026
| Metric | Benchmark |
|---|---|
| Average engagement rate for LinkedIn posts | 2–5% |
| Engagement rate for posts with images | 2x higher than text-only |
| Engagement rate for LinkedIn video | 3–5x higher than text-only |
| Engagement rate for LinkedIn carousels | 3x higher than text-only |
| Optimal post length for maximum engagement | 1,200–2,000 characters |
| Best time to post for maximum reach | 8–10am Tuesday–Thursday |
| Average reach increase from early engagement (first 60 min) | 2–3x |
| Percentage of LinkedIn content consumed on mobile | 60%+ |
| LinkedIn articles indexed by Google | ~100% |
| Average views for posts from accounts with Creator Mode | 20–30% higher |
The content-to-outreach multiplier is the most practically important relationship in this data. Sales reps who post 3–5 times per week consistently report:
- 2–4x higher connection request acceptance rates
- 30–50% higher reply rates to direct messages
- Meaningful inbound connection requests from prospects who found them through content
The mechanism is familiarity and credibility. A prospect who has seen your content in their feed three times over two weeks before receiving your connection request is not having a cold interaction — they already have a formed impression of your expertise. Your outreach becomes a continuation of a relationship that already exists, however lightly.
The engagement algorithm and outreach strategy
LinkedIn’s algorithm works in a way that directly rewards sales reps who understand it. Posts that generate engagement in the first 60–90 minutes receive dramatically expanded distribution — reaching second and third-degree connections beyond the immediate network. This creates a virtuous cycle: good content earns broad reach, broad reach brings new profile visitors, new profile visitors become connection request targets, and connection requests become outreach conversations.
Personalization’s Impact on LinkedIn Outreach: The Definitive Statistics
If there’s one variable that consistently differentiates high-performing LinkedIn outreach from average outreach, it’s personalization depth. The data across every category — connection requests, direct messages, InMail, follow-ups — shows the same pattern: specificity drives engagement.
Personalization Impact on LinkedIn Outreach Performance
| Personalization Level | Connection Acceptance | First Message Reply | Meeting Booked Rate |
|---|---|---|---|
| No personalization (generic template) | 18–22% | 1–3% | 0.5–1% |
| Light personalization (name + company) | 25–30% | 4–6% | 1–2% |
| Moderate personalization (role + pain point) | 35–42% | 8–12% | 2–4% |
| Deep personalization (specific observation + context) | 50–65% | 15–25% | 5–10% |
| Hyper-personalization (research + content reference + trigger) | 60–75% | 20–30% | 8–15% |
The jump from “light personalization” to “deep personalization” — the difference between mentioning someone’s name and company versus making a specific observation about their work — produces a 3–4x improvement in reply rates. This is perhaps the single most important data point for sales teams evaluating how to allocate outreach time.
What “deep personalization” looks like in practice:
- Referencing a specific post the prospect published in the last 30 days
- Acknowledging a company announcement or milestone
- Connecting your outreach to a pain point evident in their content or company’s public information
- Mentioning a genuine mutual connection with relevant context
- Referencing an industry trend specific to their role and company stage
The research time vs. return calculation:
Deep personalization requires approximately 5–10 minutes of research per prospect. At a 20% reply rate (versus 2% for generic outreach), that research investment produces 10x more conversations from the same number of messages sent. For most B2B sales teams, this math makes deep personalization the clear optimal strategy — even if it reduces daily outreach volume.
LinkedIn Outreach Statistics 2026: Timing, Sequence, and Safety Data
The when and how of LinkedIn outreach is as important as the what. Timing data, sequence length research, and LinkedIn’s safety limits all have direct implications for how outreach campaigns should be structured.
LinkedIn Outreach Timing Statistics
| Metric | Best Performance | Worst Performance |
|---|---|---|
| Best day for connection requests | Tuesday–Wednesday | Saturday–Sunday |
| Best day for direct messages | Tuesday–Thursday | Monday, Friday |
| Best time to send messages | 8–10am, 12–2pm (recipient timezone) | After 6pm, before 7am |
| Best time to post content | 8–10am Tuesday–Thursday | Weekend mornings |
| Average response time to LinkedIn messages | 24–48 hours | — |
| Follow-up timing for maximum reply rate | Day 4–5 after first message | Day 1–2 (too soon) |
| Optimal sequence length for cold outreach | 3–4 touchpoints over 15–21 days | — |
LinkedIn Account Safety Statistics:
Exceeding LinkedIn’s activity limits is one of the most common and consequential mistakes in LinkedIn outreach. Account restrictions can be temporary (24–72 hours) or permanent, and rebuilding a restricted LinkedIn account means starting from zero on years of network development.
| Activity Type | Safe Daily Limit | Risk Zone |
|---|---|---|
| Connection requests | 20–30 | 50+ |
| Direct messages | 100–150 | 200+ |
| Profile views | 80–100 | 150+ |
| Post likes and comments | 50–75 | 100+ |
| Total automated actions (cloud-based) | 50–100 | 150+ |
| InMail sends | Based on credits | Not applicable |
The distinction between cloud-based and browser-based automation is critical for safety. Browser-based tools run inside your browser session, produce behavioral patterns LinkedIn’s detection systems can identify, and share your personal IP address. Cloud-based tools operate from dedicated servers with dedicated IP addresses, run 24/7 regardless of your computer’s status, and simulate human-like behavior in ways that are significantly harder to detect.
Multichannel Outreach vs. LinkedIn-Only: The Performance Gap
One of the most consistent and significant findings in B2B outreach research in 2026 is the performance differential between single-channel LinkedIn outreach and coordinated multichannel sequences that combine LinkedIn and email.
Multichannel vs. Single-Channel Performance Statistics
| Metric | LinkedIn Only | Email Only | LinkedIn + Email Combined |
|---|---|---|---|
| Average reply rate | 10–25% | 2–10% | 15–35% |
| Meeting booked rate per 100 prospects | 3–8% | 2–5% | 8–15% |
| Response rate improvement vs. single channel | Baseline | Lower | +30–50% |
| Average touchpoints to first response | 2–3 | 3–5 | 4–7 across channels |
| Prospect recognition by final touchpoint | Medium | Low | High |
The 30–50% improvement in response rates from coordinated multichannel sequences reflects the compounding effect of multiple touchpoints across different contexts. A prospect who sees your name in their LinkedIn feed, receives a connection request, reads a LinkedIn message, and then receives a relevant email is having a fundamentally different experience than a prospect receiving a cold email from an unknown sender.
The familiarity and trust built through LinkedIn touchpoints directly improves email open and reply rates when those emails follow LinkedIn interactions. The channels amplify each other — and the combination consistently outperforms either channel running independently.
LinkedIn Outreach by Industry: Sector-Specific Performance Data
LinkedIn outreach performance varies significantly by industry, buyer persona seniority, and company size. Understanding these variations helps teams set realistic benchmarks and adjust strategy for their specific target market.
LinkedIn Outreach Performance by Industry:
| Industry | Connection Acceptance Rate | Direct Message Reply Rate | InMail Reply Rate |
|---|---|---|---|
| Technology / SaaS | 35–50% | 10–20% | 15–25% |
| Financial Services | 25–40% | 8–15% | 10–18% |
| Healthcare | 30–45% | 8–14% | 10–16% |
| Professional Services | 40–55% | 12–22% | 15–25% |
| Manufacturing | 25–38% | 6–12% | 8–15% |
| Marketing / Advertising | 45–60% | 15–25% | 18–28% |
| Recruitment | 50–65% | 18–30% | 20–30% |
| Education | 40–55% | 12–20% | 14–22% |
LinkedIn Outreach Performance by Seniority Level
| Seniority Level | Average Acceptance Rate | Average Reply Rate | Best Approach |
|---|---|---|---|
| C-Suite (CEO, CFO, CMO) | 20–35% | 5–12% | InMail + highly specific personalization |
| VP / Director | 30–45% | 8–18% | InMail or direct message, value-first |
| Manager | 40–55% | 12–22% | Direct message with peer-level tone |
| Individual Contributor | 50–65% | 15–25% | Direct message, low-friction CTA |
The inverse relationship between seniority and outreach performance is consistent across virtually every industry and role type. C-suite executives receive more LinkedIn outreach than any other level — and are correspondingly more selective about who they respond to. The implication for outreach strategy: reaching senior decision-makers requires higher personalization depth, more specific value propositions, and lower-friction initial asks than outreach to lower seniority levels.
Key LinkedIn Outreach Benchmarks: Summary Reference Table
For sales teams benchmarking their own performance, here’s the consolidated reference across all metrics covered in this guide:
| Metric | Below Average | Average | Above Average | Top Performer |
|---|---|---|---|---|
| Connection acceptance rate | Under 20% | 25–35% | 40–55% | 60%+ |
| First message reply rate | Under 5% | 8–15% | 18–25% | 28%+ |
| InMail open rate | Under 40% | 55–65% | 70%+ | — |
| InMail reply rate | Under 10% | 12–20% | 22–30% | — |
| Follow-up reply rate | Under 3% | 6–10% | 12–18% | — |
| Meeting booked rate (per 100 prospects) | Under 2% | 4–7% | 8–12% | 15%+ |
| Profile view to connection conversion | Under 10% | 15–25% | 30–45% | 50%+ |
| Content engagement rate | Under 1% | 2–4% | 5–8% | 10%+ |
Conclusion
The LinkedIn outreach statistics 2026 tell a clear and consistent story: the platform remains the highest-leverage B2B prospecting channel available, but the gap between average and excellent performance has never been wider.
Teams running generic, high-volume, unpersonalized outreach are seeing declining results year over year — while teams investing in research, personalization, multichannel coordination, and content strategy are seeing improving results from the same platform.
The five most actionable findings from this data:
1. Personalization is the highest-ROI investment in LinkedIn outreach. The difference between generic and deeply personalized outreach is 5–10x in reply rates — and the research investment required is typically 5–10 minutes per prospect.
2. Content and direct outreach are not separate strategies. Sales reps who post consistently see 2–4x better results from their direct outreach — because content creates familiarity before connection requests arrive.
3. Message length is a critical variable. Messages under 75 words consistently outperform messages over 200 words. Getting to the point quickly is not a tactic — it’s a demonstration of respect for the prospect’s time.
4. Multichannel sequences outperform single-channel by 30–50%. Coordinating LinkedIn and email touchpoints in a coherent sequence produces better results than either channel running independently.
5. Safety limits are non-negotiable. Exceeding LinkedIn’s daily activity thresholds creates account restriction risk that can eliminate years of network-building overnight. The performance ceiling of safe outreach is higher than most teams realize — the constraint is personalization quality, not volume.
Use these benchmarks to audit your current LinkedIn outreach performance, identify where your numbers fall relative to industry averages, and prioritize the changes most likely to move your metrics from average to top-performer territory.
Frequently Asked Questions
What is a good LinkedIn connection acceptance rate in 2026?
A good connection acceptance rate for personalized outreach is 40–55%. Top performers consistently achieve 60%+ by combining precise ICP targeting, genuine personalization, and content-based warmup before sending requests. If your acceptance rate is consistently below 25%, the most likely causes are targeting too broadly, sending generic or no connection notes, or reaching out without any prior engagement with the prospect’s content.
What LinkedIn message reply rate should I expect from cold outreach?
For well-personalized cold outreach, expect 10–20% reply rates on first messages. Generic outreach typically sees 1–5%. If your reply rates are below 5% on direct messages to first-degree connections, the most likely causes are message length (too long), lack of specific personalization, or a CTA that asks for too much too soon.
How does LinkedIn outreach performance compare to cold email?
LinkedIn InMail achieves approximately 3x higher reply rates than cold email on average — with open rates of 57–65% versus email’s 20–35%. However, LinkedIn outreach is volume-constrained by daily limits in ways that email is not. The optimal strategy combines both channels, using LinkedIn for credibility and relationship-building and email for scale and follow-up.
How many LinkedIn connection requests can I safely send per day?
The safe operational limit is 20–30 connection requests per day for established accounts. Newer accounts should start at 10–15 per day and increase gradually. Consistently exceeding 50 requests per day significantly increases the risk of account restrictions. Cloud-based LinkedIn automation tools enforce these limits automatically — browser-based tools require manual configuration.
Does posting content on LinkedIn actually improve outreach results?
Yes — consistently and measurably. Sales reps who post 3–5 times per week report 2–4x higher connection acceptance rates and 30–50% higher message reply rates compared to reps who don’t post. The mechanism is familiarity — prospects who recognize your name from content interactions are not having a cold experience when your connection request arrives.