
Most people post LinkedIn polls and call it a content win when the votes roll in. They count the numbers, maybe share the results in a follow-up post, and move on. What they miss is the part that actually builds pipeline: every vote is a named professional, at a real company, who just told you exactly what problem keeps them up at night.
That is not engagement. That is a qualified lead list, handed to you for free.
LinkedIn poll B2B lead generation in 2026 is not about going viral. It is about asking the right question, reading the room, and following up before your competitors even notice the data sitting in front of them. This article covers every step: how to build polls that qualify rather than just collect, how to turn voter data into booked discovery calls, and how to measure whether your polls are actually moving pipeline.
Why LinkedIn Polls Are a B2B Lead Generation Goldmine in 2026
LinkedIn polls are not a new feature. But the way they perform in 2026, against every other content format on the platform, has changed the conversation around how B2B marketers and sales operators should be using them.
The Numbers That Make the Case
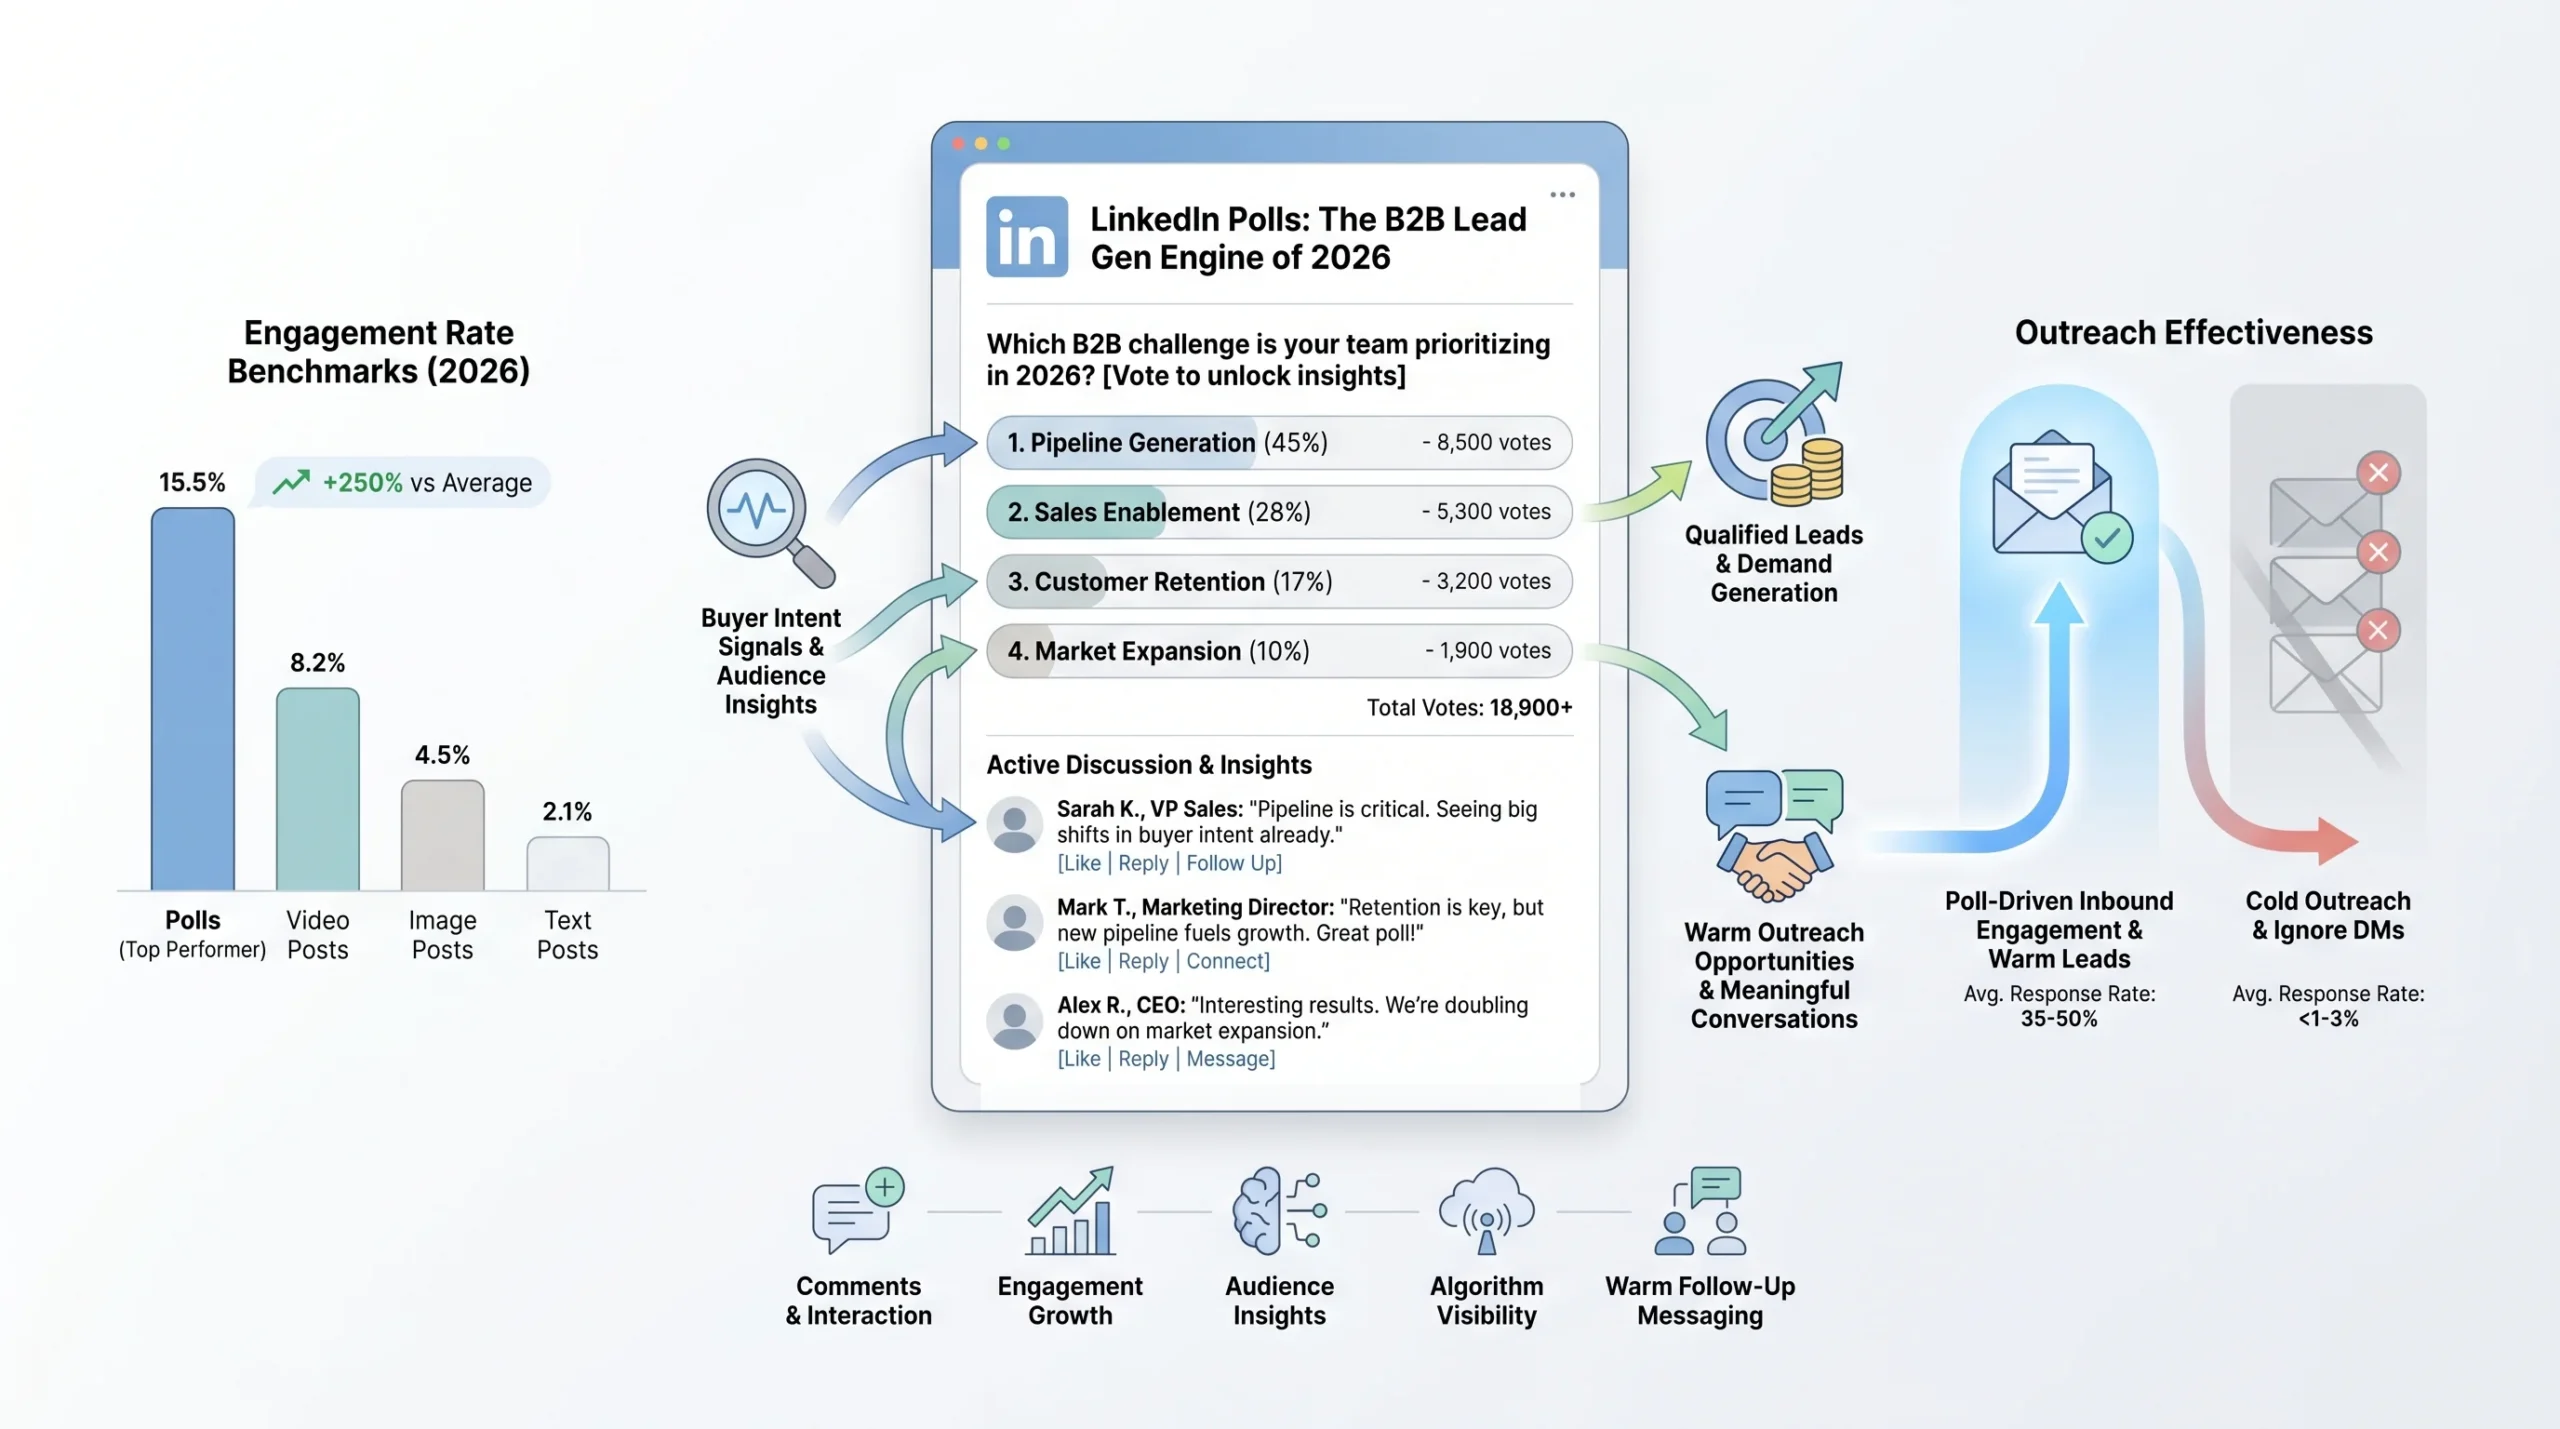
Polls now sit at an 8.9% engagement rate on LinkedIn, making them the second-highest performing content format on the entire platform, behind only Collaborative Articles. That is not a rounding error. For context, image posts average 2 to 3%, and even native video only reaches 5.1%.
Poll usage has grown 55% compared to previous years, with an average 4.40% engagement rate across all poll types. LinkedIn itself generates 75 to 85% of all B2B leads from social media, with 93% of B2B marketers active on the platform and 84% saying it delivers the best value of any channel they use.
The arithmetic is simple. If your audience is on LinkedIn, your buyers are seeing polls. The question is whether those polls are yours or your competitors’.
Why Polls Work Differently Than Every Other Format
LinkedIn polls generate 2.5 times more comments than standard posts. But the engagement rate is almost secondary to the mechanic underneath it. When someone votes on your poll, they are not passively scrolling past your content. They are making a micro-commitment, selecting an answer that reveals something real about their situation, their priorities, or their buying stage.
Poll responses reveal buyer intent signals in a way that likes and shares never can. A participant who selects the option about “difficulty getting budget approved” is not just engaging with your content. They are identifying themselves as someone with a real procurement challenge. Comments and interaction patterns layered on top of that vote offer additional clues about pain points and urgency levels. All of this happens before you send a single message.
The asymmetry is what makes it powerful. You can see who voted and what they chose. They do not know you are paying attention.
The 2026 Context: Why Cold Outreach Is Dead and Polls Fill the Gap
In 2026, 79% of B2B decision-makers actively ignore cold direct messages. LinkedIn’s algorithm now applies what practitioners call the “Volume Tax,” an algorithmic penalty that suppresses the reach and visibility of accounts that rely on high-volume, low-engagement outbound. Accounts that send large numbers of ignored or dismissed connection requests see their overall content visibility drop as a direct consequence.
Cold DMs are not just ineffective. They are actively making your other content harder to find.
Polls flip this dynamic. Instead of pushing into someone’s inbox uninvited, you create a question they choose to answer. The follow-up message references a conversation they already participated in. That is not cold outreach. That is a warm conversation with a documented starting point.
Before You Post: Define Who Your Poll Is Actually For
Skipping audience definition before posting a poll is the single most common reason polls generate hundreds of votes and zero pipeline. Volume without targeting is just noise.
Map Your Ideal Customer Profile (ICP) to Poll Topics
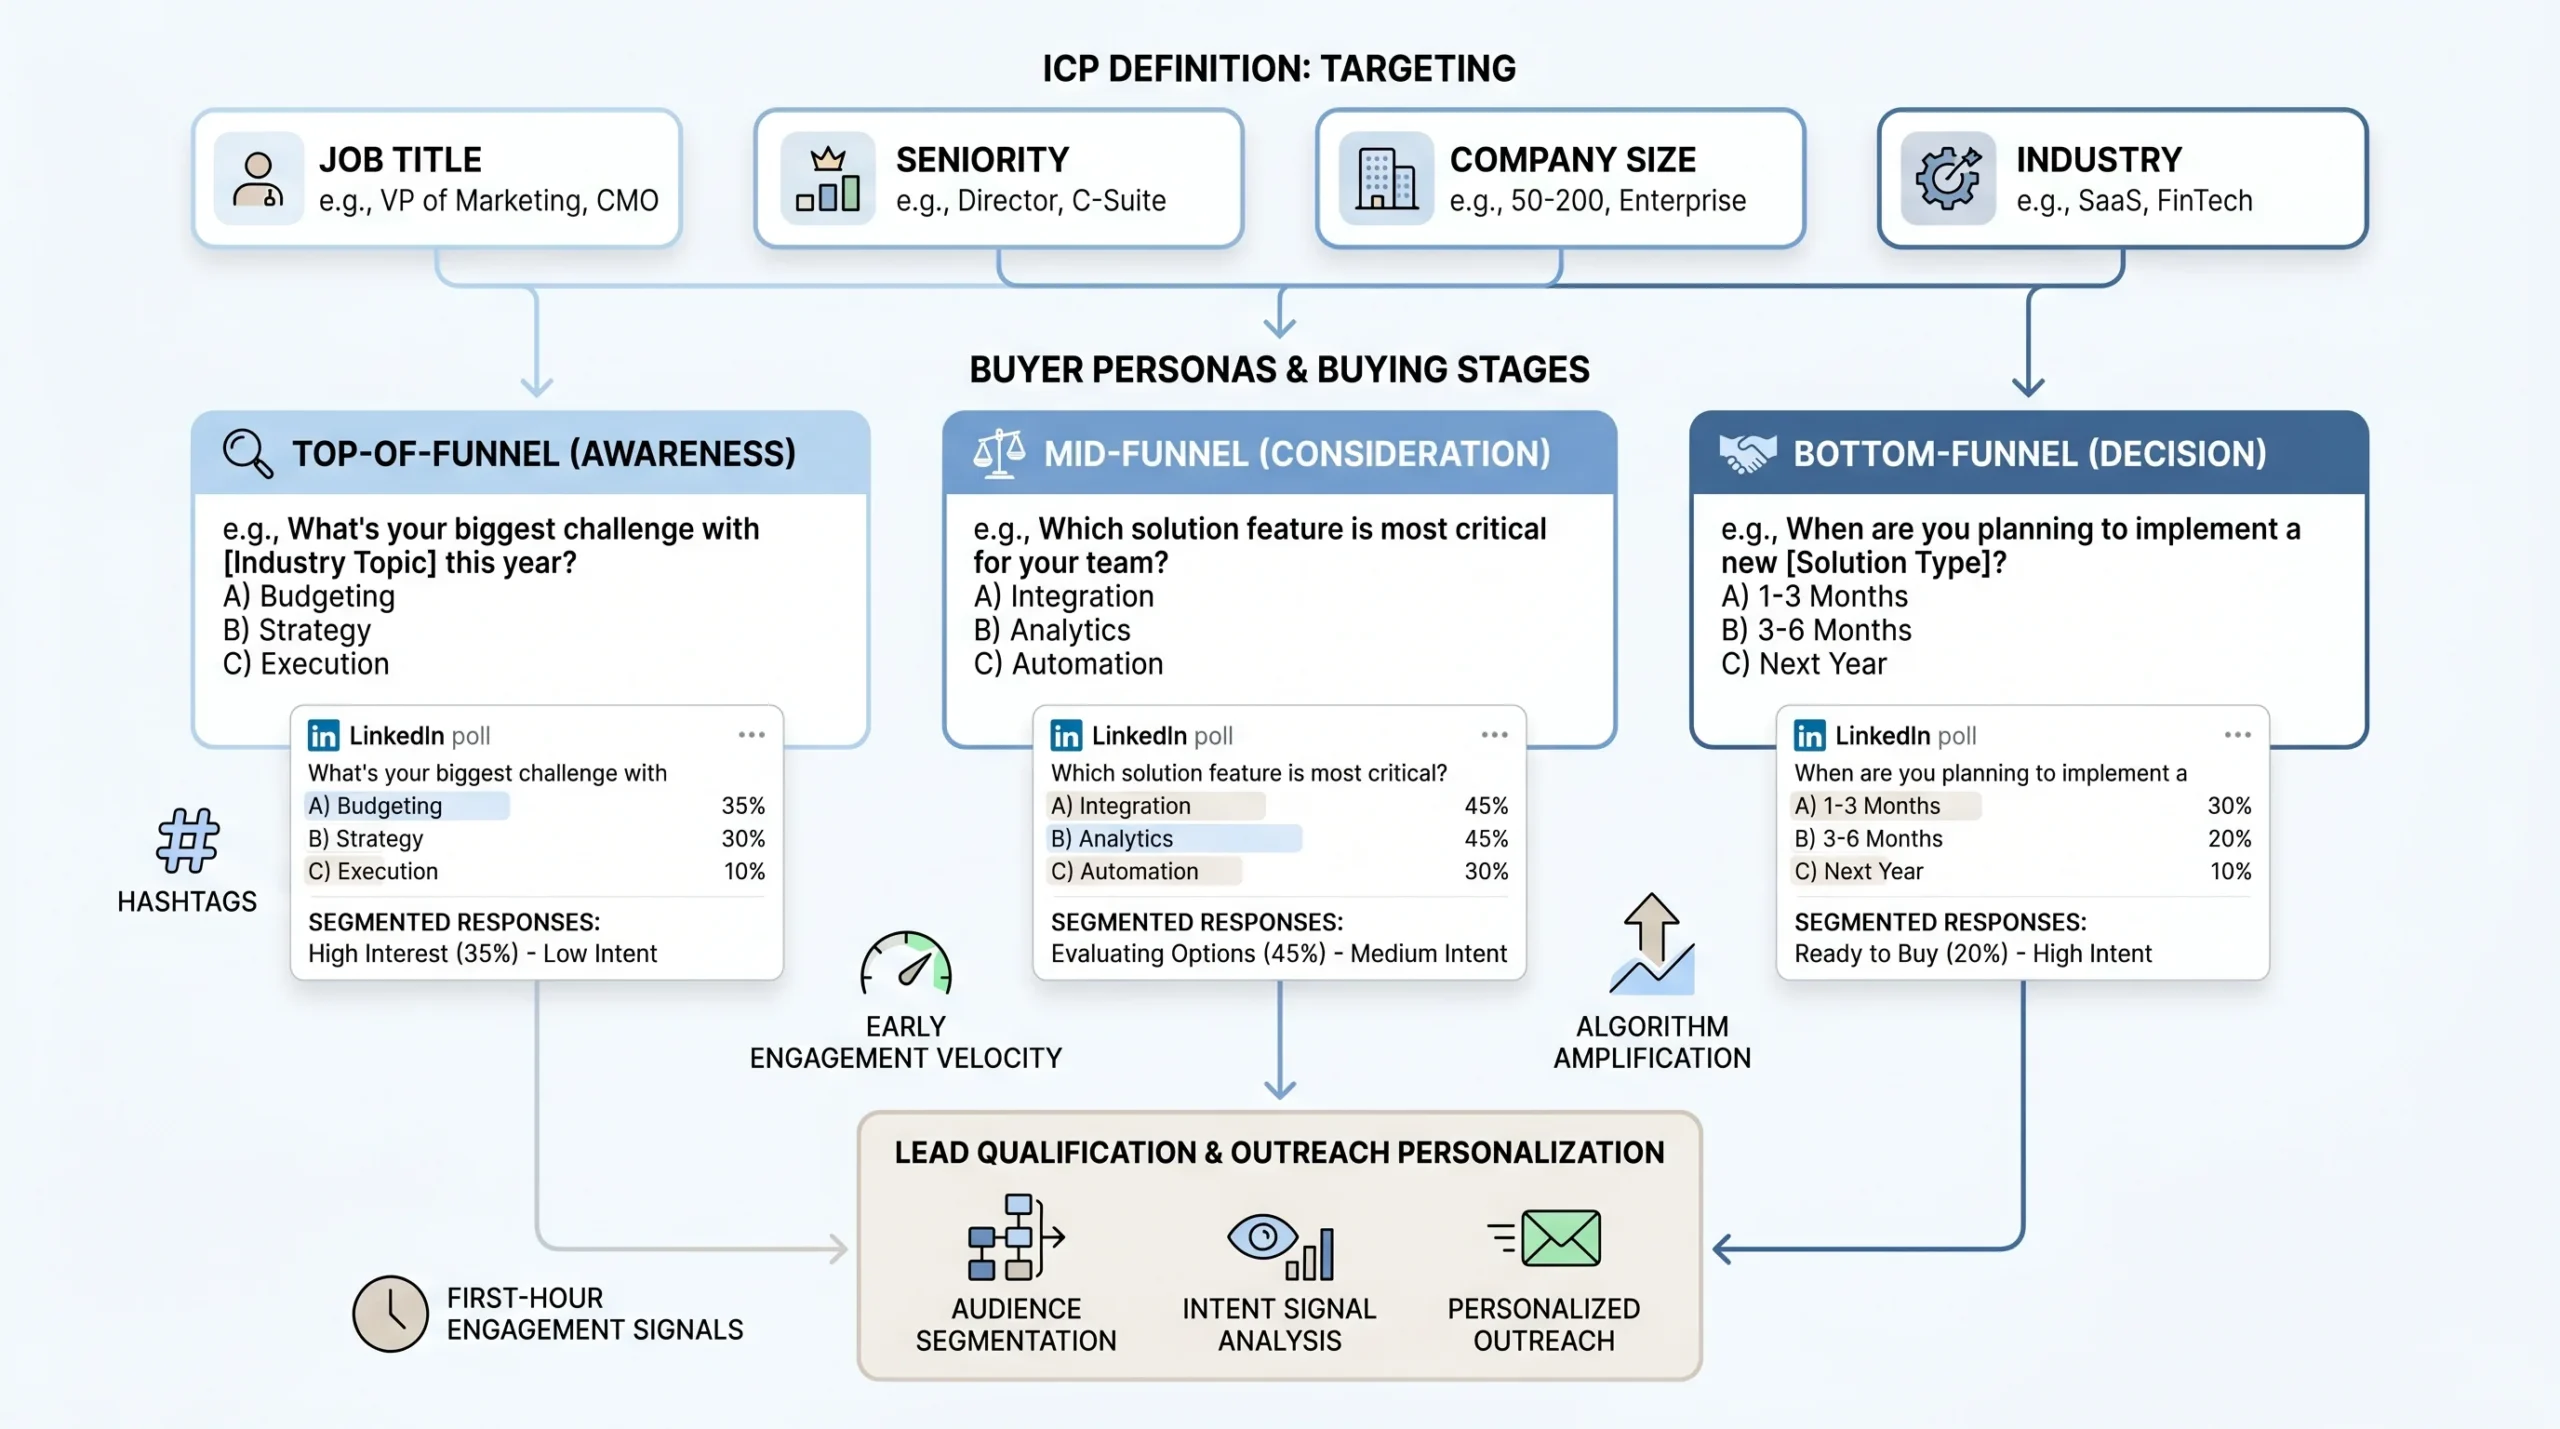
Before you write a single word of your poll question, you need to know who you are trying to surface. Your ICP definition drives every element of poll design: the question framing, the answer options, the caption copy, and the follow-up DM.
Start with the specifics:
- Job title and seniority: A poll targeting VP-level decision-makers should feel completely different from one aimed at practitioners. The language, the tension, and the stakes all shift.
- Company size: A question about enterprise procurement cycles will alienate a 10-person startup audience and vice versa. Mismatch here sends the wrong people into your follow-up sequence.
- Industry: Generic pain-point polls attract generic audiences. The more industry-specific your question, the more your ideal buyer self-selects and your non-ideal buyer scrolls past.
A poll for a VP of Sales at a 200-person SaaS company should ask about pipeline forecasting accuracy or quota attainment. A poll targeting a Marketing Director at an agency should ask about client reporting or channel attribution. The same underlying anxiety, reframed for the specific person you want sitting across from you on a discovery call.
Match Poll Questions to Buying Stage
Not every voter is equally close to a buying decision. Your poll question and answer options need to sort them before you ever open a DM.
Polls function as qualification instruments when the answer choices map to different stages of problem awareness and solution readiness. Each answer represents a different level of urgency. Option A targets basic awareness (they know the problem exists). Option B reveals intermediate challenges (they have tried to fix it and failed). Option C indicates advanced needs (they are actively evaluating solutions). Option D captures the “already tried everything” segment, the buyers who are closest to spending money and most likely to respond to a follow-up.
- Top-of-funnel polls surface awareness and broad interest. Example: “What’s your biggest challenge generating qualified pipeline this quarter?” These cast a wide net and prioritize reach.
- Mid-funnel qualification polls narrow intent. Example: “How do you currently handle LinkedIn outreach follow-up?” These sort by sophistication and process maturity.
- Bottom-funnel intent polls identify active buyers. Example: “What’s stopping you from scaling LinkedIn outreach right now?” These attract people who are already problem-aware and solution-curious.
The follow-up DM you send to a top-of-funnel voter looks nothing like the one you send to a bottom-funnel voter. Designing your polls by stage lets you personalize at scale.
Use LinkedIn’s Algorithm to Reach Beyond Your Network
Using precise LinkedIn hashtags tied to your sector increases visibility among the right audience, pushing your poll beyond your first-degree connections into the feeds of your ICP’s broader professional community. Two to three tightly relevant hashtags outperform a scatter-shot approach of five or six broad ones.
Beyond hashtags, the first hour of engagement after posting is the variable that determines whether LinkedIn’s algorithm amplifies or buries your content. Early votes and comments signal to the algorithm that this post is relevant and worth distributing further. This is why posting time matters and why having a small group of colleagues or advocates engage immediately after you publish is a legitimate strategy, not manipulation.
Engagement velocity in the first 60 to 90 minutes sets the ceiling for how far your poll travels. Everything else is secondary.
How to Build a LinkedIn Poll That Qualifies Leads (Not Just Collects Votes)
Anatomy matters. A poll with a generic question, mediocre answer options, and no caption copy will collect votes from the wrong people and generate no meaningful follow-up opportunities. Here is how to build each component with lead qualification as the primary goal.
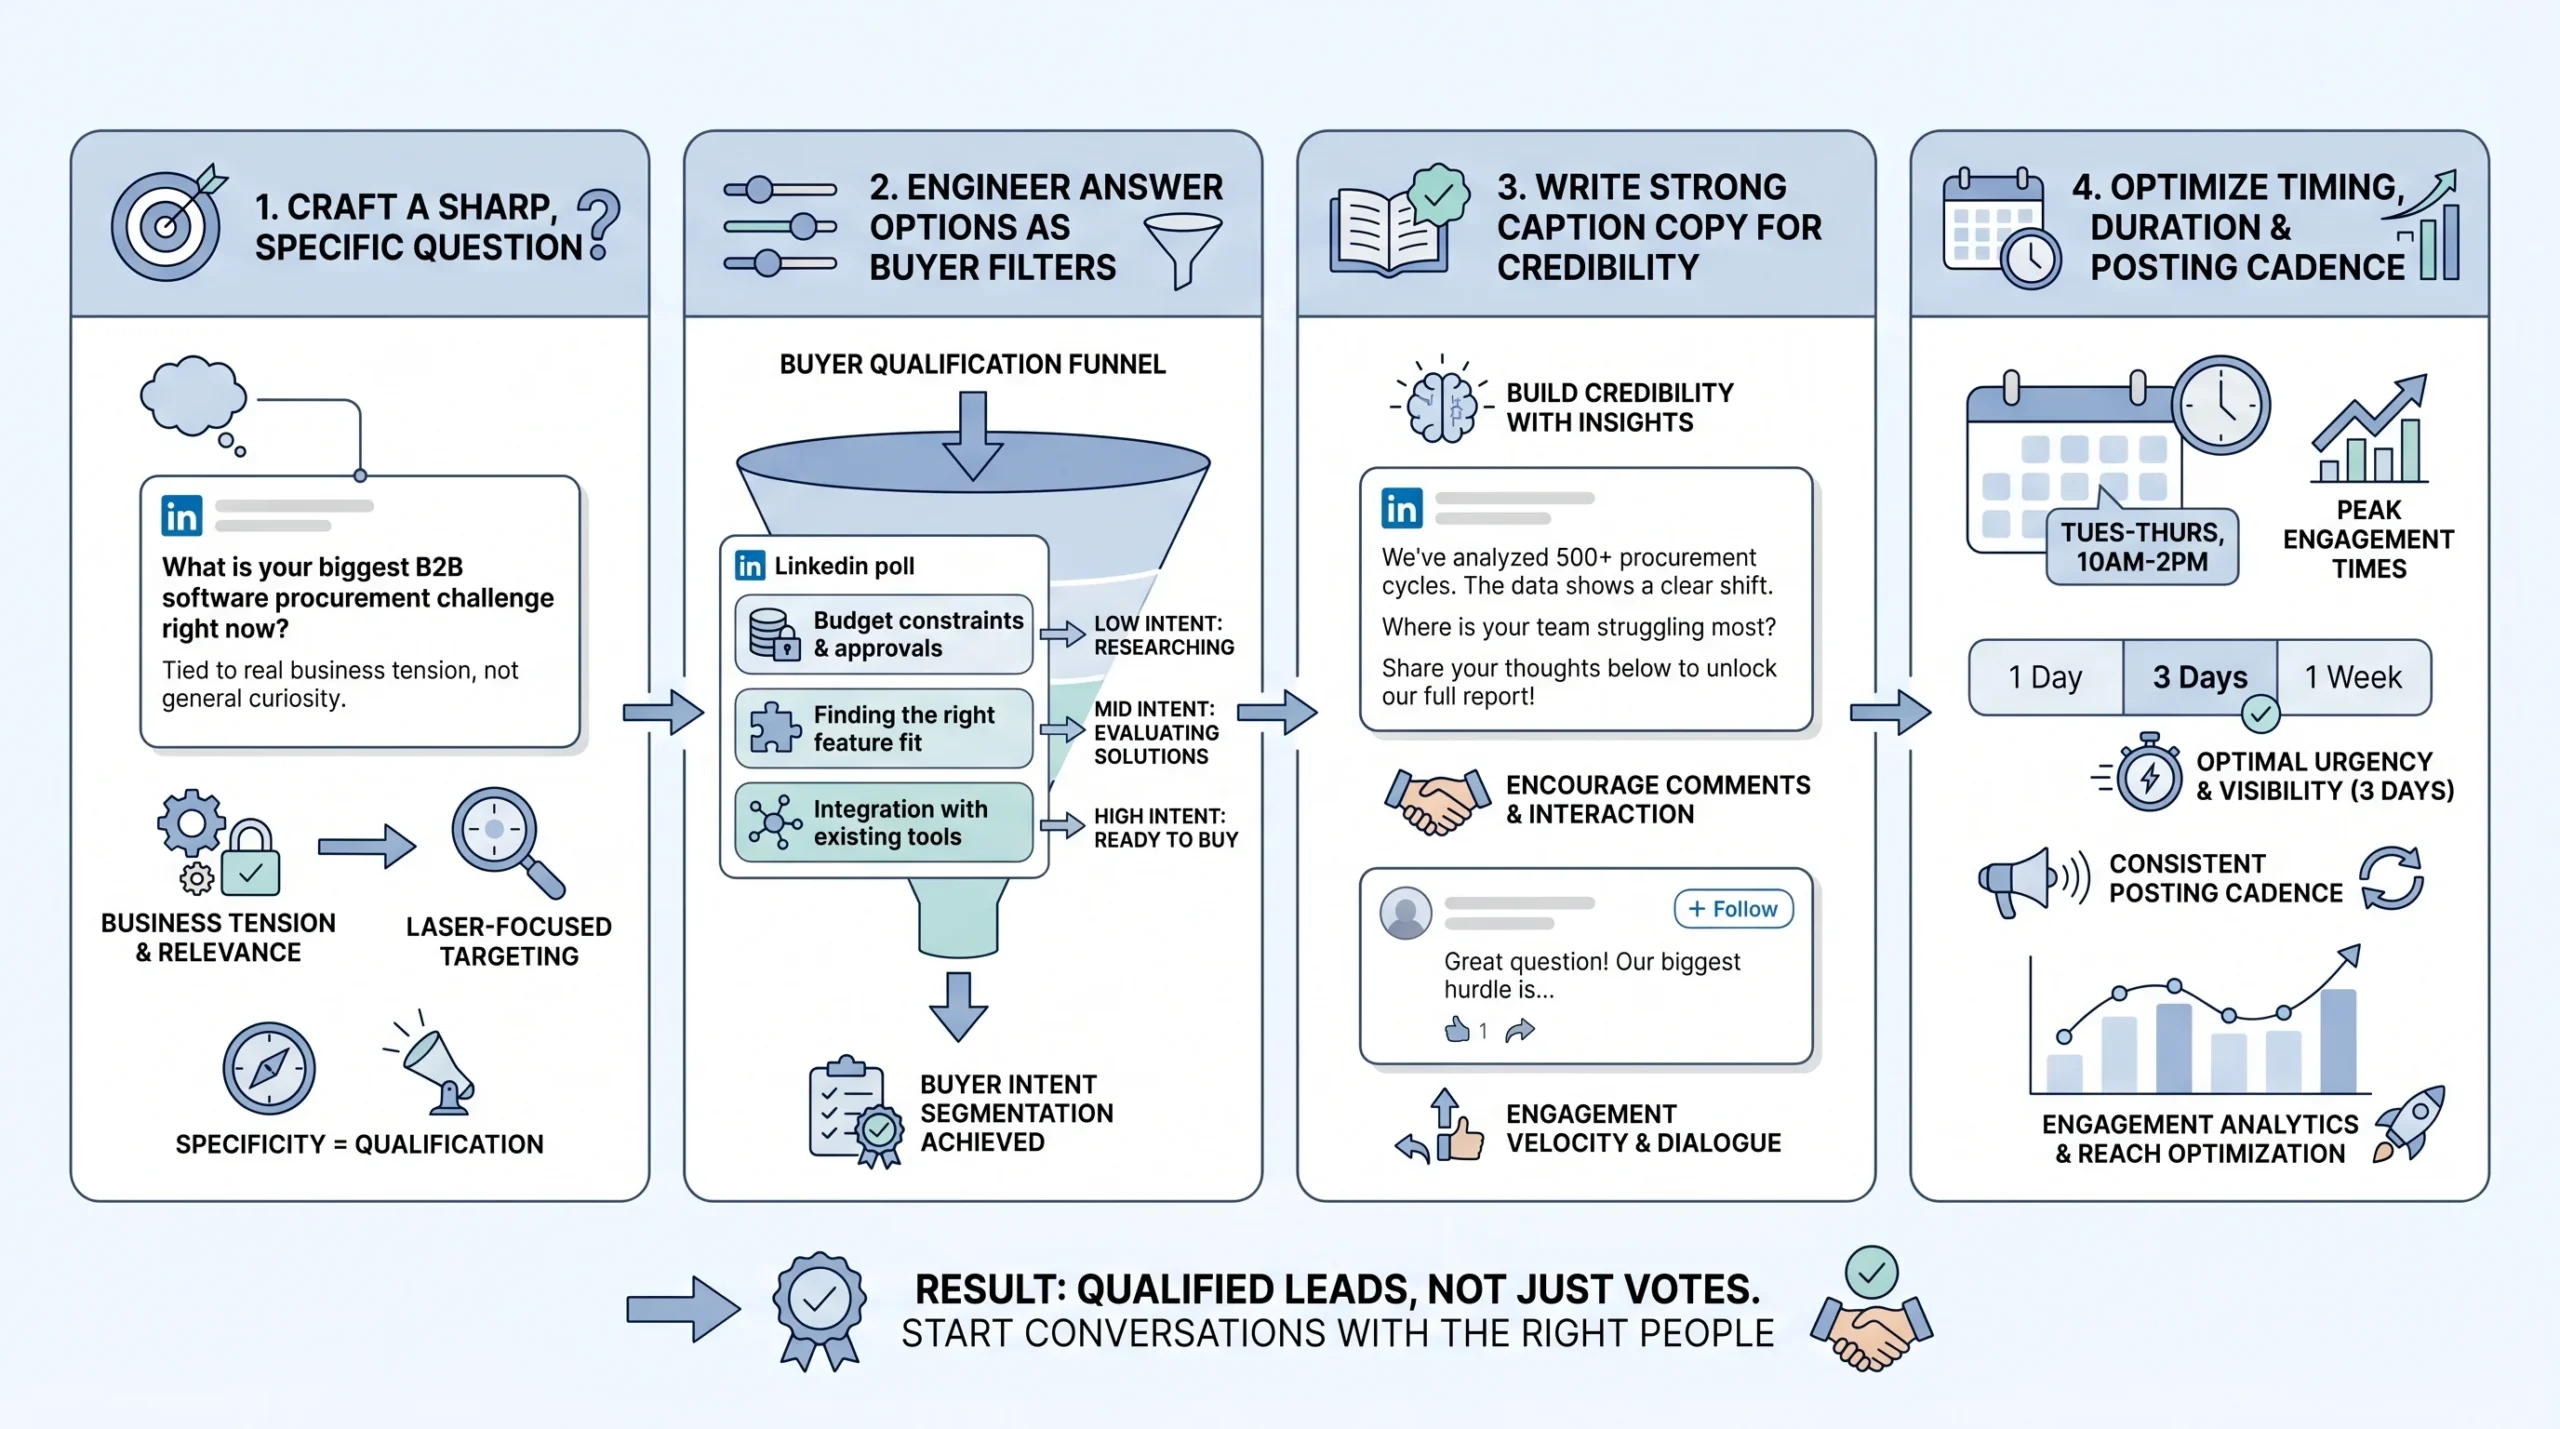
The Question: Sharp, Specific, and Tied to a Real Tension
A weak poll asks, “What’s your biggest marketing challenge?” A stronger version asks, “What slows budget approval most for B2B demand generation in 2026?” with options like attribution uncertainty, weak forecast confidence, long procurement cycles, or leadership misalignment.
The difference is specificity. The stronger question signals domain expertise before anyone votes. It tells your ICP that you understand the specific friction inside their buying process, not just that buying processes exist. That specificity is what causes the right people to stop scrolling and vote.
Apply the specificity test before you post: if a competitor in your space could post the exact same poll question without changing a word, rewrite it. Your question should be specific enough to your position and your audience that posting it is itself a positioning statement.
Keep the question under 140 characters. Not because LinkedIn requires it, but because complexity kills participation. If a busy VP has to re-read your question to understand it, they will not vote. The cognitive friction of a confusing question is enough to lose them before they engage.
Avoid yes/no questions in poll format. A yes/no question is better suited to a regular post with a call to comment. In a poll, binary choices reduce the segmentation value of the data you collect. You need answer options that sort people into meaningfully different categories.
Engineering Your Answer Options as a Qualification Filter
Your answer choices are not just options. They are a qualification questionnaire disguised as market research. Each one should represent a different stage of problem awareness or solution readiness, so that the act of voting sorts your audience into meaningful segments before you reach out.
Consider this example. A poll asking “What is your biggest challenge scaling outbound in 2026?” with options like “Finding verified contacts,” “Writing personalized messages at scale,” “Tracking responses,” and “None, outbound works fine for us” does something useful. The first three options each identify a different service need and urgency level. The fourth option tells you who to deprioritize. That is prospect segmentation happening automatically, with no CRM work required on your end.
On the question of how many options to include: the most effective polls use three answer choices. Polls with four options can reduce reach by approximately 10%. More choices dilute both the engagement rate and the clarity of your follow-up strategy. Three strong, distinct options beat four mediocre ones every time.
Writing Poll Copy That Does the Heavy Lifting
The caption above your poll is where most people fail. They treat it as filler, a one-liner like “Curious what you all think” that adds nothing. The caption is actually the most important copy you write for the entire poll.
Your caption needs to accomplish three things: establish why you are asking (credibility and context), signal what you will do with the results (this reduces hesitation), and set up a reason to engage in the comments (which amplifies algorithmic reach). A caption that does all three gives your ICP a reason to participate beyond the vote itself, which means more data, more comments, and more surface area for follow-up conversations.
One practice that separates high-performing polls from average ones: pre-plan your comment responses before you post. If your poll gets traction, comments arrive in clusters. Being ready to engage early, acknowledge edge cases, and respond to substantive contributions helps LinkedIn’s algorithm recognize the post as high-quality conversation and push it further. Early author replies are one of the clearest signals that a piece of content deserves extended distribution.
The “naked poll” mistake is posting a poll with no caption context whatsoever. A poll with no surrounding copy looks lazy, feels random, and gives your audience no reason to trust that the question is worth engaging with. It also tanks the engagement rate, because there is nothing to comment on beyond the answer options.
Timing, Duration, and Cadence
Duration affects participation in a counterintuitive way. Polls with a four-day duration outperform seven-day polls by roughly 22% in total votes. The reason is urgency. A seven-day window feels leisurely to a busy professional who can always “vote later,” and later usually never happens. A four-day window creates a natural deadline that shortens the decision window and drives faster participation.
Scheduling matters more than most people account for. Polls launched on Tuesday or Wednesday mornings between 8 AM and 10 AM in your target audience’s timezone consistently produce the highest participation rates across B2B verticals. This is when professionals are settling into their workday, catching up on their feeds before the day’s meetings take over.
On cadence: running more than three polls weekly trains your followers to expect surveys instead of substantive insight. That expectation erodes the credibility that makes B2B audiences convert. One strategically placed poll per week, paired with two or three supporting posts that reinforce the same theme, creates the content rhythm that sustains algorithmic favor and audience trust simultaneously.
The Follow-Up System: How Votes Become Pipeline
This is the section that separates poll content strategy from poll lead generation. Collecting votes without a follow-up system is the equivalent of filling a CRM and never calling anyone. The vote is the opening, not the result.
What LinkedIn Lets You See (And How to Use It)
LinkedIn polls are not anonymous. Poll creators can see exactly who voted and which option each person selected, by clicking on the vote count displayed on the poll. This visibility is not widely understood. Many poll voters assume some level of privacy. You have access to a named list of professionals who self-selected into a specific pain point category.
Use this data to build a manual lead list immediately after your poll closes. For each voter, record: full name, job title, company, company size (from their profile), and the option they selected. This takes about 20 to 30 minutes for a poll with 200 to 400 votes, which is time well spent given what you are about to do with it.
Do not wait too long to access this data. Pull it within 24 hours of the poll closing, while the engagement is fresh and while reaching out while the poll is still recent in the voter’s memory is still possible.
Segmenting Voters Before You Reach Out
Not all voters deserve the same follow-up, and sending the same message to everyone is the fastest way to feel like the cold outreach approach you are trying to avoid. Segment before you write a single DM.
- Tier 1, high intent: Voters whose answer signals active pain, whose job title matches your ICP, and whose company size is within your target range. These people get a personalized DM within 48 hours of poll close.
- Tier 2, nurture: Engaged commenters who added their perspective in the thread, regardless of how they voted. They have already demonstrated they care about the topic enough to say something publicly. They get a lighter-touch message that continues the conversation.
- Tier 3, watch list: People who viewed your profile during or shortly after the poll, indicating interest without overt participation. These go into a monitoring queue. If they engage with a subsequent post, they move up.
Segmentation by answer choice AND job title is the most powerful combination. A VP of Marketing who votes “Budget constraints” is in a fundamentally different situation than a Director of Operations who selects the same option. Their budget constraints mean different things, live in different parts of their organization, and require entirely different messaging. Sending the same DM to both signals that you did not actually read the data.
Crafting the Follow-Up DM That Does Not Feel Like a Pitch
The 48-hour window is not arbitrary. Following up within 48 hours of a poll closing keeps the context fresh for the voter, increases the probability they remember participating, and signals that you are paying genuine attention rather than running an automated sequence. Beyond 72 hours, response rates drop noticeably.
The DM structure that works follows a consistent pattern: reference the vote specifically, acknowledge the challenge they identified, offer a piece of value tied to that challenge, and then close with a soft question rather than a meeting request.
A message like “Hi [Name], I noticed your vote on my project management poll. Would you be interested in seeing how teams like yours have implemented more efficient systems? I would be happy to arrange a quick demo” works precisely because it references shared context, demonstrates individual attention, and leads with curiosity rather than a pitch. Response rates for poll-based outreach can exceed 40% when the opener references the specific vote and the message leads with value rather than a sales ask.
The critical mistake to avoid: pitching too early. A voter who picked “lack of budget” does not want to receive a pricing page in their DMs. They want acknowledgment of their specific constraint and a path toward solving it. Lead with the value, not the product.
Engaging the Comments to Surface More Leads
Commenters are often higher-intent than silent voters. They have already put a public stake in the ground on the topic. Someone who comments “We’ve been dealing with this for months, nothing seems to work” is not just a vote. They are a buyer in active pain, publicly documenting that pain for anyone paying attention.
Respond to every substantive comment publicly in a way that invites continuation. Ask a follow-up question. Validate their perspective and add a layer of insight. This approach does two things simultaneously: it builds the relationship before the private conversation starts, and it keeps the algorithm surfacing the post to new viewers because active comment threads signal high-quality content.
Any DM that opens with a reference to a poll comment, rather than just a vote, carries even higher context and typically converts at a higher rate than the vote-only follow-up. The person has already shown they want to talk about this. You are just moving the conversation to a private channel.
Turning Poll Results Into Content That Keeps Generating Leads
Most poll strategies stop at the DM sequence. The content loop that follows, if you run it correctly, is where polls compound into a long-term pipeline asset rather than a one-time lead generation event.
The Results Post: Your Most Valuable Follow-On Asset
Within 24 to 48 hours of your poll closing, publish a results post. This is not optional and it is not just a courtesy to people who voted. It is the highest-leverage content you will produce in the entire poll cycle.
The highest-converting polls are followed within 24 hours by a post that synthesizes the results and invites direct conversation. That three-part sequence of question, data, and analysis transforms a poll from a content gimmick into a pipeline-building mechanism. The results post does something the poll itself cannot: it positions you as the person who draws insight from data, not just the person who collected it.
Do not just report the percentages. Add your analysis and a point of view. “63% of you said budget approval is the biggest friction point. Here is what that tells me about how buying decisions are actually made inside mid-market SaaS companies right now.” That framing turns a data point into a thought leadership moment. It gives the people who did not vote the first time a reason to engage now. And it gives you another surface for DMs from people who respond to the insight post even if they missed the poll.
Using Poll Data as Social Proof in Sales Conversations
Poll results do not live only on LinkedIn. They become a sales asset across every channel where you have conversations with buyers.
In an outbound email: “We recently asked 400 B2B sales leaders what their biggest challenge is with pipeline forecasting. 58% said weak forecast confidence. Does that match what you’re seeing?”
In a discovery call: “Our community of 400+ operators told us that budget approval is the biggest friction point for most B2B buyers. Where does that fit in your buying process?”
In a proposal: citing that a specific percentage of your target market faces the problem you solve as contextual evidence that the problem is real and widespread.
Each of these uses the same underlying data point, but it arrives in a different context and carries different weight. The “400 operators told us” framing builds credibility in a way that “we believe” or “companies like you typically” never can. It is first-party data, collected by you, from your exact ICP, on a topic directly relevant to your sale.
Turning recurring poll themes into a quarterly insights recap gives your audience a reason to keep participating because they can see their input shaping a larger narrative. A quarterly report built from your poll data, even an informal one published as a LinkedIn article or downloadable PDF, positions you as an authority who is actively researching the market, not just selling into it.
Repurposing Poll Insights Across Content Formats
A single poll question with strong data behind it can generate content across multiple formats without feeling repetitive, because each format serves a different audience and context:
- The poll itself captures initial votes and surfaces Tier 1 prospects
- The results post re-engages the original audience and captures people who missed the poll
- A LinkedIn newsletter expands the analysis and reaches your subscriber base
- A LinkedIn article creates an indexed, search-discoverable version of the insight for organic traffic
- A sales one-pager distills the key data points for use in outbound emails and proposal conversations
The key is connecting each piece back to the same underlying insight rather than treating them as isolated content pieces. Recurring poll themes become content pillars that your audience associates with your name and your expertise. Over 12 months, a consistent monthly poll on the same general topic (for example, B2B pipeline challenges) builds a running dataset that grows more valuable with each addition.
Poll Types and Templates for B2B Lead Generation
Not every poll serves the same strategic purpose. Using the right type for the right goal prevents the common mistake of running the same question format repeatedly and wondering why the lead quality drops after the first few cycles.
The Pain Point Identifier Poll
Goal: Surface who has the specific problem you solve.
This is the most direct lead generation poll type. The question names a problem category. The answer options sort voters by which version of the problem they are experiencing. Everyone who votes is, by definition, someone who relates to the problem enough to engage.
Example question: “What’s the biggest friction point in your LinkedIn outbound process right now?”
Example options: “Finding verified contacts at scale / Writing messages that actually get replies / Handling responses consistently / We don’t have a structured outbound process”
The fourth option functions as a filter: someone who selects it needs a different conversation than the first three. They are not optimization-ready. They need a foundational conversation about outbound strategy first.
Use this poll type at the top of a campaign cycle when your goal is to fill the top of your follow-up queue with qualified names.
The Benchmark Poll
Goal: Make prospects self-assess against peers, triggering loss aversion and solution curiosity.
Benchmark polls work because B2B buyers are competitive. When someone reads a question like “How many qualified leads does your team generate per week from LinkedIn?” and selects “Fewer than 5,” the instinctive follow-up thought is: what are others doing differently?
That question creates the opening for your follow-up message. You are not pitching a solution. You are continuing a conversation about a gap they just admitted to.
Example question: “How many qualified discovery calls does your LinkedIn strategy book per month?”
Example options: “0 to 2 / 3 to 5 / 6 to 10 / More than 10”
The voters in the first bucket are the warmest leads. The voters in the last bucket might be competitor customers worth tracking or potential referral partners. The middle two are the core of your follow-up target list.
The Buying Priority Poll
Goal: Reveal where prospects are in their decision-making process.
Questions about budget priorities, current solutions, or buying timelines make prospects self-identify their buying stage, which is the most direct form of prospect qualification that does not require a conversation to achieve.
Example question: “When evaluating a new B2B sales tool, what makes or breaks the decision?”
Example options: “ROI evidence / Ease of implementation / Existing integrations / Approval from leadership”
Each answer tells you something about the buyer’s internal dynamics. Someone who says “Approval from leadership” is dealing with a multi-stakeholder sale. Someone who says “ROI evidence” needs case studies and data before they can move. Your follow-up DM should speak to the specific friction they just identified, not your product’s feature list.
The Contrarian or Debate Poll
Goal: Generate comments and profile views through a professionally provocative take.
Contrarian polls do not qualify leads directly. They generate reach and surface new audience members who then enter your ecosystem through comment engagement, profile visits, and follow-on content. They are top-of-funnel reach builders that serve the longer-term pipeline.
Example question: “Cold email is dead for B2B outbound in 2026. Agree or disagree?”
The value here is in the comments. People who disagree strongly will argue their case. People who agree will validate it and often share their own experience. Both create natural conversation threads where you can identify engaged, opinionated professionals, many of whom match your ICP.
Do not follow up on contrarian poll voters with a product pitch. Follow up with a more substantive version of the debate: a LinkedIn article, a case study, or an invitation to discuss the topic directly.
The Market Research Poll
Goal: Generate legitimate research data that positions you as an authority and feeds downstream marketing assets.
Market research polls are the long game. The immediate lead generation value is lower than pain point or benchmark polls. The long-term value, in terms of the content assets and sales ammunition the data produces, is substantially higher.
Example question: “Where does most of your B2B pipeline come from in 2026?”
Example options: “LinkedIn outreach / Inbound content / Referrals / Paid advertising”
Aggregate results from a well-distributed market research poll become an asset you can reference for months. “We surveyed 500 B2B practitioners and found that 41% of their pipeline comes from LinkedIn” is a credible, original data point that earns media mentions, newsletter citations, and inbound traffic from people searching for that specific statistic.
Measuring What Actually Matters: Poll ROI for B2B
Poll performance is easy to measure wrong. The metrics LinkedIn surfaces by default are reach, impressions, and vote count, none of which tell you whether the poll built pipeline.
Vanity Metrics vs. Pipeline Metrics
The metrics to ignore:
- Total vote count (reach with no follow-up is worth nothing)
- Total impressions (a proxy for content performance, not business performance)
- Likes and reactions (engagement hygiene, not pipeline signals)
The metrics that matter:
- Voter-to-DM conversion rate: Of Tier 1 voters identified, how many did you reach out to?
- DM-to-reply rate: Of the DMs sent, how many received a response?
- Reply-to-call rate: Of the replied conversations, how many converted to discovery calls?
- Poll-influenced deals: Of the deals closed in a given period, how many trace back to a poll interaction as the first touchpoint?
The last metric is the hardest to track without a CRM, but it is also the most important one for making the case, internally or to clients, that polls are a serious lead generation channel and not just a content tactic.
Building a Simple Poll Tracking System
A spreadsheet is enough to start. For each poll, track: poll topic, number of votes, number of Tier 1 voters identified, number of DMs sent, number of replies, number of calls booked, and deals influenced.
Over time, this creates a dataset that tells you which poll topics generate the highest quality leads (not just the most votes), which answer options correlate most strongly with buyers who eventually take a call, and which ICP segments respond most reliably to poll-based outreach. None of this intelligence is available from LinkedIn’s native analytics. You have to build it yourself.
Run this tracking from your first poll. The data from month one is not particularly useful in isolation. The data from month six, compared against month one, tells you exactly what to do differently.
Benchmarks to Aim For in 2026
LinkedIn polls achieve a 4.40% average engagement rate across the platform. Use that as your baseline. If your polls are consistently underperforming that number, the problem is usually the question specificity, the caption copy, or the posting time.
On the follow-up side: founders and sales operators who reply personally to every Tier 1 voter consistently report booking 4 to 7 discovery calls per poll cycle. That is not a guarantee, and it depends heavily on audience size, ICP alignment, and the quality of the follow-up message. But it is a reasonable benchmark for what good looks like when the full system is running correctly.
Integrating Polls Into Your Broader LinkedIn Lead Generation System
Polls generate the most pipeline when they are connected to the rest of your LinkedIn presence rather than running as isolated content experiments.
The connection request flow is one of the most direct integrations. A Tier 1 voter who has not connected with you yet is an ideal candidate for a personalized connection request that references the poll. The connection acceptance rate on a request like “I noticed you voted on my poll about [topic] and your perspective aligns with what I’m seeing across [ICP] companies” dramatically outperforms a cold “I’d like to connect” request from a stranger.
Once connected, poll voters enter a nurture sequence built around the theme of the poll. A voter who identified budget approval as their main friction point should see follow-on content about budget conversations, ROI frameworks, and stakeholder alignment over the next 30 to 60 days. Each touchpoint reinforces the relationship established by the initial poll, compounding the value of that first vote over time.
For Account-Based Marketing (ABM) campaigns, poll engagement data is a reliable signal for account prioritization. An account where multiple employees voted on your poll, especially if they selected high-intent options, should move up the priority list in your outreach sequence. Multiple votes from one company is a buying committee conversation waiting to happen.
Strategic posting generates 3.2 times more qualified leads than daily generic updates. Polls are most effective as part of a deliberate weekly content plan. One poll per week, flanked by two to three supporting posts on the same theme (an insight post before the poll, a results post after it), creates a content rhythm that the algorithm rewards and that your ICP begins to recognize and engage with consistently.
Conclusion
LinkedIn polls for B2B lead generation work because they remove the friction that makes cold outreach fail. Instead of pushing a pitch into someone’s inbox, you ask a question they want to answer. Instead of guessing at their challenges, you let them tell you. Instead of following up cold, you follow up with context.
The strategy is specific, not complicated. Ask a sharp question that your ICP relates to. Engineer answer options that sort voters by pain point and buying stage. Follow up within 48 hours with a DM that references their specific vote and leads with value. Publish a results post that extends the reach of the original poll and creates new conversation entry points. Track what converts, not what gets the most votes.
Here is how to put that into action over the next 30 days:
Week 1: Define your ICP down to job title, company size, and industry. Identify the top three pain points your solution addresses. Post your first pain point identifier poll on Tuesday or Wednesday morning. Pull voter data within 24 hours of closing.
Week 2: Execute your Tier 1 follow-up DM sequence. Publish the results post with your analysis and a point of view. Track DM replies and calls booked. Begin building your poll performance spreadsheet.
Week 3: Post your second poll, using either a benchmark format or a buying priority format depending on what your Week 1 results tell you about your audience. Refine your DM copy based on Week 1 response rates.
Week 4: Repurpose your strongest poll insight into a LinkedIn article or newsletter piece. Review your 30-day tracking data to identify which poll topic and which voter segment produced the best conversion rates. Use that information to plan your next 30-day cycle.
The votes are already out there. Your ICP is already on LinkedIn, already answering questions from your competitors, already identifying their pain points publicly. The only question is whether you are the one asking.
Frequently Asked Questions
Can LinkedIn poll creators see who voted?
Yes. LinkedIn polls are not anonymous. Poll creators can see the full name, job title, and company of every person who voted, along with which option they selected. You access this by clicking on the vote count displayed on your poll. This visibility is what makes polls useful for B2B lead generation: every vote is a named, qualified prospect who has identified their own pain point.
How many votes does a typical LinkedIn poll get?
Performance varies significantly by audience size, question quality, and posting time. Polls achieve an average 4.40% engagement rate on LinkedIn in 2026. A profile with 5,000 followers posting a well-crafted poll at the right time can realistically expect 100 to 300 votes. Accounts with 10,000 or more engaged followers regularly see 500 to 1,000+ votes on high-resonance questions.
What is the ideal LinkedIn poll duration?
Four days. Polls with a four-day duration outperform seven-day polls by approximately 22% in total votes. Seven-day polls feel leisurely to busy professionals who defer participation indefinitely. Four days creates enough urgency to drive faster decisions without cutting off participation entirely.
How soon after a poll closes should I follow up with voters?
Within 48 hours of the poll closing. The follow-up window is not arbitrary. Beyond 72 hours, the poll is no longer fresh in the voter’s memory, the contextual relevance of your DM drops, and response rates decline noticeably. High-intent voters should receive a personalized message within 24 hours if possible.
How many LinkedIn polls should I post per week?
One. Running more than three polls weekly trains your followers to expect surveys instead of substantive content, which erodes the credibility that makes B2B audiences convert. One strategically designed poll per week, paired with two or three supporting posts on the same theme, is the cadence that sustains both algorithmic reach and audience trust.
What should a LinkedIn poll follow-up DM say?
The structure that works: reference the poll and the specific option they selected, acknowledge the challenge that answer represents, offer a relevant piece of value (a resource, a data point, an insight), and close with a soft question rather than a meeting request. Avoid pitching a product in the first message. Response rates for poll-based outreach exceed 40% when the opener references the specific vote and leads with value.
How many answer options should a LinkedIn poll have?
Three. Polls with four options can reduce reach by approximately 10% compared to three-option polls. Three distinct, meaningful options give you adequate segmentation data without the reach penalty. Avoid yes/no formats in polls; binary choices reduce the qualification value of the data you collect.
What time should I post a LinkedIn poll?
Tuesday or Wednesday mornings between 8 AM and 10 AM in your target audience’s primary timezone consistently produce the highest participation rates across B2B verticals. Avoid posting late on Fridays or over the weekend, when professional engagement on LinkedIn drops sharply.
How do I use LinkedIn poll results in sales conversations?
Reference the aggregate data as first-party research in outbound emails, discovery calls, and proposals. Framing like “We surveyed 400 B2B operators on this question and found that 58% experience this exact challenge” carries more credibility than general claims about market problems. Poll results become a recurring source of original, citable data that you own and can deploy across every stage of the sales process.
What is the biggest mistake people make with LinkedIn polls?
Failing to follow up with voters. Most people post a poll, count the votes, and move on. The vote data is the point: it is a named list of professionals who have self-identified their pain points. Without a structured follow-up system that segments voters by intent and reaches out within 48 hours, a poll is an engagement metric, not a pipeline asset.
How do I measure whether LinkedIn polls are generating pipeline?
Track these four metrics for every poll: voter-to-DM conversion rate (how many Tier 1 voters did you contact), DM-to-reply rate, reply-to-call rate, and poll-influenced deals over time. LinkedIn’s native analytics measure content performance, not business performance. Building a simple spreadsheet that connects poll activity to downstream pipeline outcomes is the only way to know whether your poll strategy is actually working.
Are LinkedIn polls effective for all B2B industries?
Polls perform well across B2B verticals when the question is specific to a real professional tension within that industry. They work particularly well in industries where buyers are active LinkedIn users: SaaS, professional services, marketing and advertising, financial services, HR technology, and enterprise software. They tend to underperform in highly technical or niche industries where LinkedIn is not the primary professional community.