

There’s a moment every agency owner or sales leader dreads: the monthly check-in call where your client asks, “So what exactly happened with our outreach this month?” You send over a spreadsheet with 1,200 connection requests, 340 replies, and 12 meetings booked. Silence. Then: “What does that mean for us?”
That’s the problem with how most people handle a LinkedIn outreach report for clients. They dump data. They assume numbers speak for themselves. They don’t.
The best agencies don’t report on activity. They report on outcomes. They frame results in terms the client actually cares about: pipeline value, cost per qualified conversation, ROI on the campaign, and clear next steps. They build trust through transparency. They show exactly where the money is moving in the funnel.
This article walks you through building a LinkedIn outreach report for clients that does all three: demonstrates real value, shows your work, and sets up the next campaign for even better results. You’ll get a practical template, the exact metrics that matter, and how to present them so your client doesn’t just see data but understands what it means for their business.
Why Most LinkedIn Outreach Reports Fall Flat (And What Your Client Actually Needs)
Here’s what I’ve seen: agencies send reports that list activity metrics and expect clients to celebrate. Connection requests sent: 2,500. Reply rate: 18%. Meetings scheduled: 23.
The client reads this and thinks one of three things: (1) “I have no idea if this is good,” (2) “This doesn’t tell me anything about pipeline,” or (3) “Why did I hire an agency if I can just do this myself?”
Your job as the person delivering results is not to report activity. It’s to answer one question: “Did this outreach move my revenue forward?”
The difference is fundamental. Activity reporting is what lazy operators do. Outcome reporting is what professionals do. And it’s not hard. It just requires you to think like your client before you write a single word.
Your client didn’t hire you to send LinkedIn connection requests. They hired you to generate qualified conversations that can turn into customers. They want to know: How many of those conversations moved toward a deal? How much pipeline did we create? What’s the expected revenue impact? What’s the cost per qualified lead? And what should we do differently next month?
A good LinkedIn outreach report for clients answers all of that. It shows the complete funnel from first touch to qualified opportunity. It puts numbers into context. And it builds the case for your next campaign before you even ask for it.
What Metrics Actually Matter When Reporting LinkedIn Outreach Results to Clients
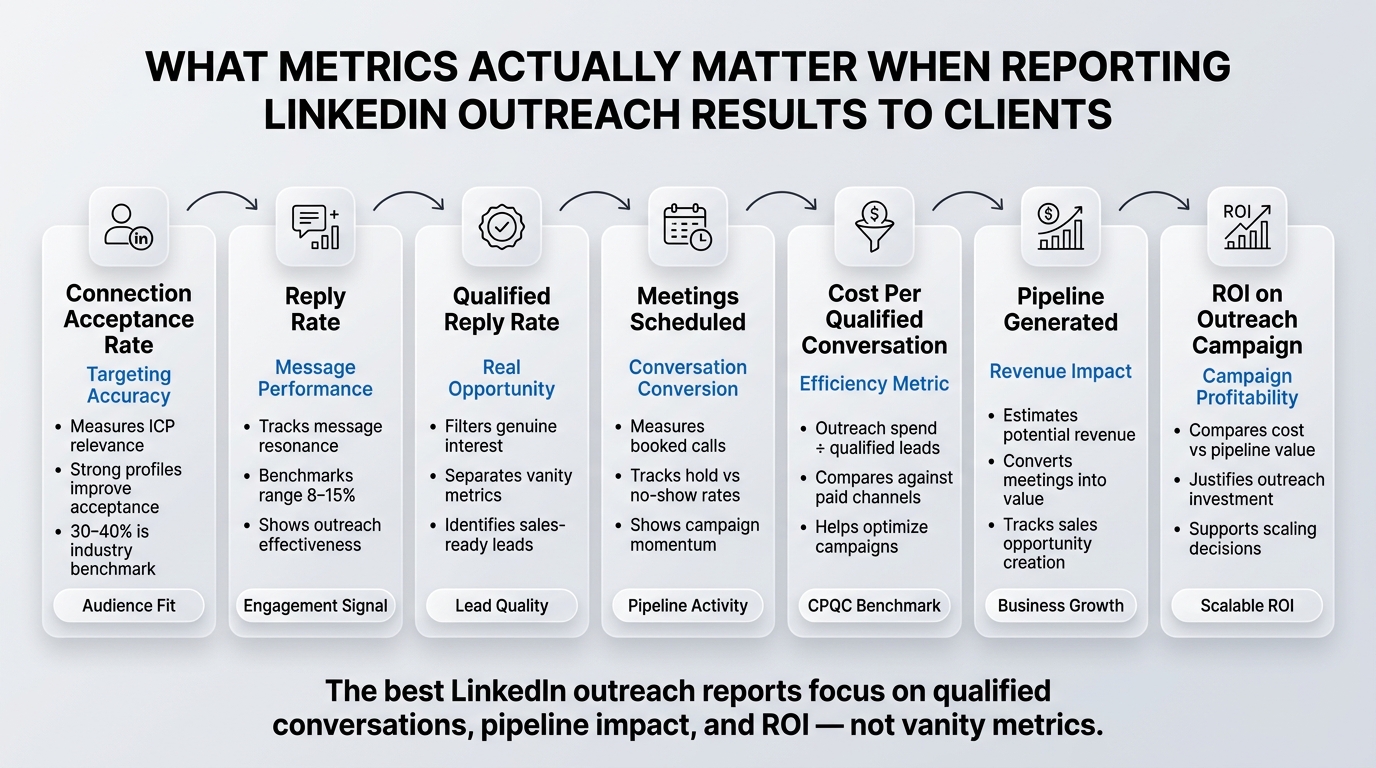
Not every number belongs in a client report. Some metrics are for your internal operations only. Some inflate the numbers without adding insight. Some miss the point entirely.
Let me break down what actually matters, and why each one shows up in the reports clients respect.
Connection Acceptance Rate
This is your starting point. Out of all the connection requests you sent, what percentage did prospects accept? LinkedIn benchmarks sit around 30 to 40% for well-targeted cold outreach. Some teams hit 50% or higher if they’re going after a very specific, high-intent audience.
Why it matters to clients: It tells them whether your targeting is sharp. A 50% acceptance rate means you’re reaching people who recognize your ICP and want to talk. A 15% acceptance rate means something is wrong with the message, the profile, or the targeting. It’s an early-stage signal. Don’t hide it. Explain it.
Reply Rate (and Reply-to-Message Rate)
This is the percentage of accepted connections who replied to your first message. Industry benchmarks are typically 8% to 15% for well-written outreach on cold connections. Some niches (tech, finance, high-ticket B2B services) see higher reply rates. Some (low-intent lists, mass blasts) see much lower.
The distinction matters: a reply doesn’t mean a qualified reply. Someone might say “Not interested” or “Who’s this?” Those are replies. They’re not opportunities.
Why it matters to clients: Reply rate directly reflects message quality and audience fit. A high reply rate (12%+) tells clients your message resonates. A low reply rate (under 5%) means either the targeting is off or the message isn’t compelling. This is where most reports should spotlight what worked and what didn’t.
Qualified Reply Rate
This is the subset of replies that indicated genuine interest, a real objection you could address, or a meeting request. It’s smaller than the overall reply rate, but it’s the one that counts.
Why it matters to clients: This is where you separate vanity metrics from real results. A company might celebrate 150 replies. But if only 18 of those were from qualified prospects, the real number is 18. Your job is to call out that distinction and explain why even lower-quality replies have value (they tell you what messaging works, who your real ICP is, and where to focus next).
Meetings Scheduled and Meetings Held
How many actual conversations did the outreach generate? And of those scheduled, how many actually happened? No-show rates matter. Some clients have 60% meeting hold rates. Some have 90%. The gap tells you something important about your follow-up, reminder strategy, or the quality of the meeting request.
Why it matters to clients: Meetings are where qualification begins. This is the moment when a prospect shifts from being a name on a list to a real business conversation. This number should always appear in a report because it’s the closest thing to a clear conversion milestone.
Cost Per Qualified Conversation (CPQC)
Take your total outreach spend (tools, labor, software costs) and divide it by the number of qualified conversations generated. If you spent $5,000 on outreach in a month and created 45 qualified conversations, your CPQC is roughly $111 per qualified conversation.
Why it matters to clients: This connects the investment directly to the output. It’s how clients compare outreach to other lead generation channels (paid ads, events, partnerships). A CPQC of $150 is good in some industries and expensive in others. But once you establish it, you have a repeatable benchmark. Next month, you’re trying to hit $140. The month after, $125. Clear targets create accountability.
Pipeline Generated
How much revenue value did the outreach generate? This is the most important metric and the one most reports get wrong.
Here’s the tricky part: most outreach doesn’t create immediate closed deals. It creates conversations that move into the pipeline. Your job is to track the conversation value based on your deal probability assumptions.
For example: If your average deal value is $40,000 and your average sales cycle is 90 days, then a qualified conversation might be worth $8,000 to $15,000 in pipeline value (assuming a 20% to 40% conversion probability). If outreach creates 45 qualified conversations, your pipeline impact is $360,000 to $675,000.
Why it matters to clients: It translates activity into business impact. Instead of “we got 45 meetings,” the client hears “we generated $500,000 in potential revenue.” That’s a completely different conversation.
ROI on the Outreach Campaign
Take the pipeline value generated and subtract the cost. If the outreach cost $8,000 and generated $500,000 in pipeline value, the ROI is roughly 6,150%. Of course, not all of that pipeline will close. But it’s the right framing. Not every qualified conversation will convert, but many will.
Why it matters to clients: It shows that the outreach investment is working. It justifies the spend and builds the business case for scaling.
How to Structure Your LinkedIn Outreach Report for Clients (Proven Framework)
There’s a right way and a wrong way to present these metrics. The wrong way is a spreadsheet with every column populated. The right way is a narrative: here’s what we did, here’s what happened, here’s what it means.
The Executive Summary Section
Start here. Before any detailed metrics, give the client a 30-second summary of the month. It should answer one sentence: “What did we accomplish?”
Example: “This month, our outreach campaign generated 52 qualified conversations from a list of 8,500 prospects, creating approximately $624,000 in pipeline value at a cost per qualified conversation of $115.”
That’s it. That’s the answer to the question the client is really asking. Everything that follows is support and detail.
The Campaign Overview
Next, give context. What was the outreach strategy this month? Who were we targeting? What was the message? This should be brief, but it matters because it explains why the results happened the way they did.
“We targeted VP-level operations leaders at companies with 100 to 500 employees in the logistics and 3PL space. Our message focused on how companies in their category are using workflow automation to reduce manual data entry by 40%. We sent 8,500 connection requests with a 35% acceptance rate.”
Why this section matters: It shows the client that you’re thinking strategically, not just blasting out connection requests. It also provides context for the results. If your reply rate was lower than expected, you can say “which tells us the message needs adjustment toward ROI outcomes rather than process improvements” instead of just admitting failure.
The Metrics Dashboard
This is where the numbers live. Present the key metrics in a simple, visual format. Don’t use a spreadsheet. Use a simple table or chart that the client can scan in under 30 seconds.
Here’s what a good metrics dashboard looks like:
| Metric | This Month | Last Month | Change | Target |
|---|---|---|---|---|
| Connection Requests Sent | 8,500 | 8,200 | +3.7% | 8,000 |
| Connection Acceptance Rate | 35% | 36% | -1pp | 35% |
| Accepted Connections | 2,975 | 2,952 | +0.8% | 2,800 |
| Messages Sent to Connections | 2,975 | 2,952 | +0.8% | 2,800 |
| Total Replies | 387 | 310 | +24.8% | 350 |
| Overall Reply Rate | 13% | 10.5% | +2.5pp | 12% |
| Qualified Replies | 52 | 38 | +36.8% | 45 |
| Qualified Reply Rate | 1.75% | 1.29% | +0.46pp | 1.5% |
| Meetings Scheduled | 52 | 38 | +36.8% | 45 |
| Meetings Held | 46 | 31 | +48.4% | 40 |
| No-Show Rate | 12% | 18% | -6pp | 10% |
| Cost Per Qualified Conversation | $115 | $145 | -$30 | $120 |
| Estimated Pipeline Value | $624,000 | $434,000 | +43.8% | $500,000 |
| ROI on Outreach Spend | 7,450% | 3,900% | +3,550pp | 5,000% |
This table tells a story without requiring explanation. The client can see at a glance: We’re hitting our targets. We’re improving month-over-month. We’re generating significant pipeline.
The Detailed Breakdown: What’s Working and What Isn’t
Now dig into specifics. Which messages got the best reply rates? Which prospect segments generated the most qualified conversations? Where did we see friction, and what are we doing about it?
Example section:
“Our strongest segment this month was logistics directors at mid-market companies (250-500 employees). This group had a 18% reply rate and a 3.2% qualified reply rate. In contrast, our outreach to VP-level prospects had a 9% reply rate and 1.1% qualified rate.
Implication: We should scale messaging to directors while refining our value prop for VPs. The director messaging about workflow automation and time savings is resonating. The VP messaging about ROI and strategic outcomes is not. Next month, we’ll test a revised VP message focused on compliance and audit readiness, which came up in 40% of VP conversations.
We also saw a significant lift in reply rates from prospects we had engaged with 60+ days ago (17% reply rate vs. 11% for cold). This tells us that persistence works, and that we should implement a 90-day re-engagement sequence for prospects who didn’t reply the first time.”
This section does three things: it explains the numbers, it acknowledges what’s working and what isn’t, and it shows the client that you’re thinking about optimization, not just reporting.
The Qualitative Insights: What We Learned About the Market
Numbers without insight are just noise. Great reports include what you learned about the prospect, the market, or the message. What objections came up most? What triggered the highest-quality replies? What surprised you?
“One unexpected finding: 28% of qualified replies mentioned that their current tool was missing mobile functionality. This came up unprompted. It tells us there’s an unmet need in this market around mobile-first design. If your product roadmap includes a mobile app, this is a signal that the market is ready for it. If it doesn’t, this is where competitors might have an advantage.”
Clients love this. It shows you’re paying attention to the market, not just running a campaign.
The Recommendations Section: What We’re Doing Next Month
End with clear action items. What will change next month? Why? What results do you expect?
“Based on this month’s data, we’re making three changes in June:
- We’re scaling outreach to the director-level segment from 40% to 60% of our total volume, given the higher conversion rate.
- We’re pausing outreach to certain industry verticals (agriculture, retail) that showed 5% or lower reply rates. We’ll restart these segments with a completely rewritten message designed for their specific pain points.
- We’re implementing a 60-day re-engagement sequence for non-responders. Historical data suggests 12-15% of non-responders will reply to a second campaign. With 6,000 non-responders, we expect this to generate 700 to 900 additional qualified conversations over the next 90 days.”
This turns the report into a strategy. The client doesn’t just see what happened. They see what’s next and why you’re confident it’ll work.
Red Flags That Make Your Report Lose Credibility
Before you send a LinkedIn outreach report to your client, read it through one more time and ask: does anything here look sketchy?
Inflated metrics
If you’re celebrating a 25% reply rate, something is wrong. Either the list is tiny and not representative, or you’re counting non-qualified replies as qualified. Client reports should include realistic benchmarks. If your reply rate is 8%, say 8%. Explain why 8% is good for the strategy you’re running. Don’t round up to 12% and hope they don’t ask questions.
Activity disguised as results
“We sent 50,000 connection requests this month.” Great. How many of those turned into actual conversations? Don’t bury the conversion metrics. Lead with them.
Missing the actual pipeline
The worst reports are the ones that show meetings scheduled but say nothing about whether those meetings turned into opportunities. Did any of those 50 meetings result in a discovery call scheduled with the client’s sales team? Did any move into the pipeline? You need to track this. If you’re running outreach for a client, you need to know what happens after the meeting.
No context for year-over-year or month-over-month change
“We got 40 qualified meetings this month.” Is that good? Good compared to what? A great report always includes a comparison: this month vs. last month, this month vs. the same month last year, this month vs. our benchmark for this strategy. Without context, the number means nothing.
Omitting costs
Some agencies bury the cost section. They report on results but make the investment hard to find. Transparency builds trust. Put the cost right there next to the results. It’s not a problem if CPQC is higher than expected. It becomes a problem if the client feels like you’re hiding something.
Making excuses instead of solving
If results are below target, don’t blame the list, the market, or the platform. Take responsibility. Explain what’s not working, and show what you’re doing to fix it. Clients respect accountability. They hate excuses.
The Complete LinkedIn Outreach Report Template for Clients
Here’s a ready-to-use template. You can modify it based on your specific campaigns and metrics, but this framework works across industries and campaign types.
[CLIENT NAME] | LINKEDIN OUTREACH REPORT
[MONTH/YEAR]
EXECUTIVE SUMMARY
[Insert 1-2 sentence summary of results and key achievement]
Example: “This month, our outreach campaign generated 52 qualified conversations and created approximately $624,000 in pipeline value. We exceeded our qualified conversation target by 15% and improved our cost per qualified conversation by 26%.”
CAMPAIGN OVERVIEW
Strategy: [What was the outreach strategy? What was the goal?]
Target Audience: [Who were we reaching?]
List Size: [How many prospects?]
Value Proposition: [What was the core message?]
Timeframe: [What dates did we run?]
KEY PERFORMANCE INDICATORS
| Metric | Count | Rate | vs. Target | vs. Previous Month |
|---|---|---|---|---|
| Connection Requests Sent | ||||
| Connection Acceptance Rate | ||||
| Accepted Connections | ||||
| Messages Sent | ||||
| Total Replies Received | ||||
| Overall Reply Rate | ||||
| Qualified Replies | ||||
| Qualified Reply Rate | ||||
| Meetings Scheduled | ||||
| Meetings Held | ||||
| No-Show Rate | ||||
| Cost Per Qualified Conversation | ||||
| Estimated Pipeline Value | ||||
| ROI on Campaign |
PERFORMANCE ANALYSIS
What Worked Well
[Identify the top-performing segments, messages, or cohorts. Include specific percentages and insights.]
Example: “Our outreach to marketing leaders at SaaS companies generated a 16% reply rate and 2.8% qualified rate. This segment accounted for 35% of qualified conversations this month. The message framework emphasizing marketing automation and lead routing resonated strongly, suggesting this is a high-fit ICP.”
What Didn’t Work
[Identify underperforming areas. Be honest about what fell short and why.]
Example: “Outreach to IT directors in non-tech industries underperformed with a 6% reply rate and 0.4% qualified rate. This suggests our messaging about engineering efficiency is not relevant to this audience. We’re pausing this segment next month and redesigning the message around compliance and security, which came up in 60% of IT conversations.”
Market and Prospect Insights
[Share what you learned about the market, the prospect, or their pain points through this outreach.]
Example: “In our conversations with qualified prospects, three themes emerged:
- 45% of prospects mentioned challenges with data security and compliance.
- 38% mentioned budget constraints and pressure to do more with existing resources.
- 32% mentioned integrations with existing tools as a requirement, not a nice-to-have.
These insights should inform your product roadmap and sales pitch going forward.”
DETAILED METRICS BREAKDOWN
By Industry Segment
[Create a mini-table or chart showing performance by industry, region, company size, or other relevant segment]
Example:
| Segment | Requests Sent | Acceptance Rate | Reply Rate | Qualified Replies | CPQC |
|---|---|---|---|---|---|
| SaaS / Software | 2,100 | 38% | 16% | 28 | $98 |
| Professional Services | 1,800 | 34% | 11% | 14 | $135 |
| Manufacturing | 1,600 | 31% | 8% | 8 | $180 |
| Finance / Insurance | 1,500 | 36% | 13% | 12 | $125 |
| Other | 1,500 | 33% | 9% | 6 | $155 |
By Company Size
| Size | Requests Sent | Acceptance Rate | Reply Rate | Qualified Replies | CPQC |
|---|---|---|---|---|---|
| 10-50 employees | 2,800 | 36% | 14% | 25 | $110 |
| 51-250 employees | 3,200 | 35% | 12% | 20 | $128 |
| 251-1000 employees | 1,800 | 34% | 11% | 9 | $145 |
| 1000+ employees | 700 | 33% | 10% | 3 | $180 |
These breakdowns let the client see which segments are working and which ones might need adjustment. They also help you build the case for next month’s strategy.
QUALIFIED CONVERSATION OUTCOMES
Of the [X] qualified conversations generated, here’s what happened:
- resulted in a follow-up conversation scheduled with your sales team
- are still in active dialogue (next step pending)
- expressed interest but are not yet sales-qualified
- declined or went silent
[Optional: Add pipeline value for each category]
This section is critical because it connects outreach to actual business outcomes. Don’t just report on the meetings. Report on what those meetings turned into.
RECOMMENDATIONS FOR NEXT MONTH
Based on this month’s results, we recommend:
- Action: [What change?] Rationale: [Why this change?] Expected Impact: [What results do you expect?]
- Action: [What change?] Rationale: [Why this change?] Expected Impact: [What results do you expect?]
- Action: [What change?] Rationale: [Why this change?] Expected Impact: [What results do you expect?]
Example:
- Action: Scale outreach to mid-market SaaS companies from 25% to 45% of total volume. Rationale: This segment generated a 2.8% qualified rate and a $98 CPQC, our best performance of the month. Growing volume in this segment should improve overall campaign efficiency. Expected Impact: Increasing volume by 20 percentage points should generate approximately 18-22 additional qualified conversations next month.
- Action: Redesign messaging for IT leaders in non-tech industries and resume outreach to this segment. Rationale: Previous messaging was misaligned with their pain points. New messaging will focus on compliance and security, which came up in 60% of conversations with this audience. Expected Impact: We expect this segment to see a 2-3 point improvement in reply rate and a 0.5-1% improvement in qualified rate.
- Action: Implement a 60-day re-engagement sequence for non-responders. Rationale: Historical data shows 12-15% of first-time non-responders will reply to a second campaign. With 6,000 non-responders, this could generate 720-900 additional qualified conversations. Expected Impact: An additional 15-25 qualified conversations with minimal incremental cost.
APPENDIX: ADDITIONAL DATA
[Include any additional details, charts, or deep dives that are interesting but not essential to the main narrative. This might include message performance by version, response time analysis, or other tactical insights.]
How to Personalize Your Report and Build Client Trust
Here’s where a template becomes a real tool: personalization. Every client is different. Every campaign is different. The template is your structure, but your insights are what separates your report from every other report.
Reference conversations you had during the campaign
“During a call with a prospect in your space, they mentioned that their procurement process takes 120+ days. This is longer than typical and suggests there’s organizational friction we’ll need to account for in sales conversations.”
Clients love this because it shows you’re not just running a mechanical campaign. You’re paying attention.
Connect the metrics to their specific business goals
Don’t just report on CPQC. Connect it to their pipeline goal. “Your stated goal this quarter is to generate $2 million in pipeline. At our current CPQC of $115 and an average deal value of $50,000, we need to generate 40 qualified conversations to hit that target. This month we generated 52, so we’re on track to exceed the goal.”
This is how you make numbers meaningful.
Acknowledge the qualitative shifts you see happening
“We’re seeing more objections around implementation and technical fit, which is different from last month. This tells us the market is further along in the buying journey. Your sales team should prepare for more technical questions during discovery calls.”
This shows you’re thinking strategically about what the data means, not just collecting it.
Call out anomalies and explain them
“Our reply rate jumped 24% month-over-month. We’ve identified three factors: (1) the new message framework emphasizes ROI instead of features, (2) we’re targeting a slightly smaller but more focused prospect list, and (3) we’re seeing seasonal engagement increases as teams finalize budgets.”
Transparency about why things changed builds credibility.
The Frequency and Format Question: Monthly vs. Quarterly Reports
Should you report monthly or quarterly? The answer depends on your campaign size and the client relationship.
Monthly reports work best for high-volume campaigns (5,000+ connection requests per month) where you have enough data to see patterns. They also work for clients who are tracking quota closely or who have allocated a specific budget to LinkedIn outreach and want to see ROI month-to-month.
The downside: monthly can feel reactive. You’re responding to that month’s data without the benefit of seasonal or longer-term trends.
Quarterly reports work better for smaller campaigns (1,000-3,000 requests per month) where monthly fluctuations can be noise. They also work better for relationship-building campaigns where the goal is to keep your brand in front of prospects for 90+ days before expecting conversion.
Quarterly also gives you room to show compounding value. “Over the last quarter, we generated 145 qualified conversations and $1.8 million in pipeline value. The CPQC improved 18% from Q1 to Q2, showing that our targeting and messaging are both getting sharper.”
My recommendation: Start with monthly for the first three months to establish baseline metrics and build credibility. Then move to quarterly if the client is satisfied and if you can point to compounding value over time.
The Conversation Around the Report: How to Present It and Handle Pushback
Sending a report is step one. Having a conversation about it is step two, and it’s where most agencies drop the ball.
Schedule a 20-30 minute call specifically to review the report. Don’t try to do it in an email or as a side conversation. The report deserves focus.
Structure the call this way:
- Open with the executive summary. “Here’s what we accomplished this month.” Give them the headline before getting into detail.
- Walk through the metrics. Explain what each number means and why it matters. Don’t assume they understand reply rates or CPQC. Walk them through it.
- Highlight what worked. Spend time on the wins. “This segment had a 2.8% qualified rate, which is excellent. Here’s why it worked and where we’re going to double down.”
- Address what didn’t work head-on. If results are below target, say so. Explain why. Show what you’re doing to fix it. Clients respect honesty more than spinning bad news.
- End with next steps. “Based on what we learned, here’s what we’re changing next month. Here’s why. And here’s what we expect.”
Handling the client who doesn’t think the results are good enough
If a client looks at your report and says “I don’t think 52 qualified conversations is enough,” here’s how to handle it:
First, get context. “What were you expecting?” Listen. Then ask follow-up questions: “What does a qualified conversation mean to you? What needs to happen in that conversation for you to count it as a win? How many of these conversations do you expect to turn into opportunities?”
Often, the client has unrealistic expectations about either the number of conversations or the conversion rate. Your job is to gently reset those expectations with data.
“Let me give you some context. For cold outreach to your target audience, a 1.75% qualified reply rate is above industry benchmark. That means for every 100 people who see our message, roughly 1.75 respond with genuine interest. With 2,975 messages sent, 52 qualified responses is actually outperforming what most agencies deliver.
Now, I also know that not every qualified conversation will turn into an opportunity. Industry conversion rates are typically 20-30%. So of these 52 conversations, we’d expect 10-15 to become real sales opportunities. Does that align with what your team is seeing?”
This conversation transforms the report from a list of numbers into a strategy discussion. It also sets you up to be the trusted advisor, not just the vendor.
Mistakes in LinkedIn Outreach Client Reporting (and How to Avoid Them)
Mistake 1: Reporting on activity instead of outcomes
Wrong: “We sent 15,000 connection requests.”
Right: “We sent 15,000 connection requests to marketing leaders at SaaS companies, generated 52 qualified conversations, and created $624,000 in estimated pipeline value. Our cost per qualified conversation improved 26% month-over-month.”
Activity is what you do. Outcomes are what matters to the client.
Mistake 2: Cherry-picking metrics
Wrong: Reporting only on connection acceptance rate (which was 35% and good) while burying reply rate (which was 6% and bad).
Right: Reporting on all key metrics and explaining why the underperformance happened and what you’re changing.
Selective reporting destroys trust the moment the client finds the number you buried.
Mistake 3: Making excuses
Wrong: “Reply rates were lower this month because LinkedIn is harder than it used to be.”
Right: “Reply rates declined 2 points month-over-month. We’ve identified three factors: (1) the industry segment we targeted had less budget urgency than previous months, (2) we’re refining our message framework, and (3) seasonal patterns show this week is typically 15% slower than others. We expect reply rates to normalize next month, and we’re also testing new messaging to improve performance.”
Clients want to know you’re in control, not at the mercy of the platform.
Mistake 4: No context for benchmarks
Wrong: “Our reply rate was 10%.”
Right: “Our reply rate was 10%, which is above the 6-8% industry benchmark for cold B2B outreach. For our specific ICP (mid-market SaaS), the benchmark is typically 8-12%, so we’re tracking slightly above average.”
Benchmarks give the client a frame of reference. Without them, numbers are just numbers.
Mistake 5: Forgetting the business impact
Wrong: Reporting CPQC without connecting it to pipeline or revenue impact.
Right: “Our CPQC improved to $115. With an average deal value of $50,000 and a 25% conversion rate, each qualified conversation represents approximately $12,500 in potential revenue. At that rate, this month’s 52 qualified conversations represent $650,000 in potential revenue against a $5,980 investment.”
Always connect the metrics back to revenue. That’s the conversation the client is actually having in their head.
Conclusion
The best LinkedIn outreach reports aren’t just about presenting numbers. They’re about telling the story of what happened, why it happened, and what you’re going to do about it. They prove that you understand your client’s business, that you’re paying attention to the market, and that you’re thinking strategically about every campaign.
When you report on LinkedIn outreach results to clients, you’re not just showing activity. You’re showing how that activity is turning into conversations, opportunities, and revenue. You’re proving that the investment is working. And you’re building the trust that turns clients into long-term partners.
Start with the template in this article. Adapt it to your specific campaign. Add your own insights about the market and the prospects. Schedule a real conversation around the report, not just an email. And then watch as your client stops asking “Is this working?” and starts asking “How can we scale this?”
Frequently Asked Questions
What’s a good qualified reply rate for LinkedIn outreach?
A qualified reply rate of 1.5% to 2.5% is excellent. This means that for every 100 people you message, 1.5 to 2.5 respond with genuine interest. Industry benchmarks sit around 1% to 1.5% for standard B2B outreach. If you’re hitting 1.8%, you’re above benchmark. If you’re hitting 0.5%, you need to revise your targeting or message.
How do I explain CPQC to a client who’s never heard of it?
Cost per qualified conversation (CPQC) is simply your total campaign spend divided by the number of genuine business conversations generated. For example, if you spend $8,000 on a campaign and create 60 qualified conversations, your CPQC is $133. It’s a way to measure how efficient your outreach is. The lower the CPQC, the more conversations you’re generating per dollar spent. A good CPQC depends on your industry and deal size, but generally lower is better.
Should I report on pipeline value even if deals haven’t closed yet?
Yes. Pipeline value shows the revenue impact of your outreach based on the conversations generated and your expected conversion rate. If your average deal is $50,000 and you generate 50 qualified conversations with a 20% conversion probability, that’s $500,000 in pipeline value. This number gives your client a sense of the business impact, even though the revenue hasn’t landed yet.
How do I handle a report where results are significantly below target?
Be direct and transparent. Explain what went wrong, take responsibility, and show what you’re changing. For example: “Our qualified reply rate was 0.8%, below our 1.5% target. We’ve identified that our message framework wasn’t resonating with this ICP and that our targeting was too broad. Next month, we’re narrowing the target list by 30%, focusing only on companies that meet your core ICP criteria, and we’re testing a revised message that emphasizes ROI over process improvement.” Clients respect honesty and action more than excuses.
How frequently should I send reports to my client?
Monthly reports work best for high-volume campaigns (5,000+ connection requests per month) where you have enough data to spot trends. Quarterly reports work better for smaller campaigns or when you’re running longer nurture sequences where monthly fluctuations are noise. I recommend monthly for at least the first three months, then reassess based on the campaign size and client preferences.
What if my client’s sales team isn’t following up on the qualified conversations we generate?
This is common. The solution is to add a “closed-loop” metric to your report that shows what percentage of qualified conversations resulted in a follow-up with the sales team. If qualified conversations are being generated but not followed up on, the problem isn’t with your outreach. It’s with the sales team’s process. Bring this to the client’s attention and recommend that you align on follow-up requirements so you can measure true end-to-end impact.
Should I include competitor analysis in my report?
Only if it’s directly relevant to the client’s campaign. For example, if you’re running outreach to a specific competitor’s customers, noting how your message resonates with that segment is valuable. Comparing your CPQC to what competitors charge is not. Stay focused on the client’s results, not on benchmarking against other agencies.
How do I report on campaigns with very low volume?
Low-volume campaigns (fewer than 1,000 connection requests) are noisy. Month-to-month fluctuations can be big. Instead of reporting monthly, consider quarterly or rolling 60-day reports where you can average out the volatility. You can also break results down by segment (industry, company size, role) to find patterns that aren’t visible in the overall numbers.
What’s the best format for sharing a report? Email, PDF, presentation?
Email is fine for very small clients. For anything else, I recommend a PDF that’s professionally formatted and easy to scan, plus a 20-30 minute call where you walk through it and answer questions. Presentation format (slides) is overkill unless you’re presenting to a committee. Keep it simple and visual.
How do I track which conversations turned into actual customers?
You need closed-loop reporting. This means your outreach tool or CRM tracks not just the conversation, but also whether it resulted in a pipeline opportunity, and if that opportunity closed. Most modern CRMs can do this through API integrations. Set up integrations so that when you log a qualified conversation in your outreach tool, it creates a linked record in your CRM, and you can track it all the way to closed deal. Without this, you’re missing the most important metric: ROI.
Is it ever OK to include vanity metrics in a report?
No. Avoid pure activity metrics that don’t tie to outcomes. “We sent 20,000 connection requests” is vanity unless it’s paired with outcomes. Always pair activity metrics with conversion metrics and business impact. This keeps the report grounded in reality and prevents inflating results.